
SPECpower_ssj2008
Host 'WIN-2Y8EPIOJY83' Performance Report
Copyright © 2007-2011 Standard Performance Evaluation Corporation
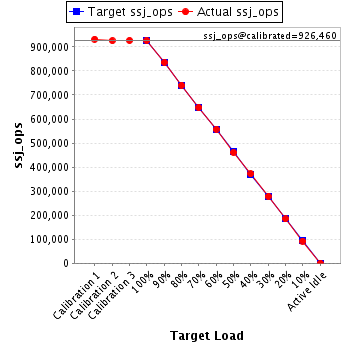
| Hitachi, Ltd. BS320 Server Blade C51P5 | ssj_ops@100% = 926,616 ssj_ops@100% per JVM = 154,436 |
||||
| Test Sponsor: | Hitachi, Ltd. | SPEC License #: | 35 | Test Method: | Multi Node |
| Tested By: | Hitachi, Ltd. | Test Location: | Hadano, Kanagawa, Japan | Test Date: | Feb 8, 2011 |
| Hardware Availability: | Feb-2011 | Software Availability: | Jun-2010 | Publication: | Feb 23, 2011 |
| System Source: | Single Supplier | System Designation: | Server | Power Provisioning: | Line-powered |
| Target Load | Actual Load | ssj_ops | |
|---|---|---|---|
| Target | Actual | ||
| Calibration 1 | 932,190 | ||
| Calibration 2 | 925,628 | ||
| Calibration 3 | 927,291 | ||
| ssj_ops@calibrated=926,460 | |||
| 100% | 100.0% | 926,460 | 926,616 |
| 90% | 90.2% | 833,814 | 836,036 |
| 80% | 79.9% | 741,168 | 740,474 |
| 70% | 69.9% | 648,522 | 647,876 |
| 60% | 60.2% | 555,876 | 557,980 |
| 50% | 49.8% | 463,230 | 461,350 |
| 40% | 40.1% | 370,584 | 371,646 |
| 30% | 30.1% | 277,938 | 278,423 |
| 20% | 19.9% | 185,292 | 184,153 |
| 10% | 10.0% | 92,646 | 92,368 |
| Active Idle | 0 | 0 | |
| Set Identifier: | sut |
| Set Description: | System Under Test |
| # of Identical Nodes: | 10 |
| Comment: | None |
| Hardware | |
|---|---|
| Hardware Vendor: | Hitachi, Ltd. |
| Model: | BS320 Server Blade C51P5 |
| Form Factor: | Blade |
| CPU Name: | Intel Xeon X5675 |
| CPU Characteristics: | Six Core, 3.06GHz, 12MB L3 Cache |
| CPU Frequency (MHz): | 3067 |
| CPU(s) Enabled: | 12 cores, 2 chips, 6 cores/chip |
| Hardware Threads: | 24 (2 / core) |
| CPU(s) Orderable: | 1,2 chips |
| Primary Cache: | 32 KB I + 32 KB D on chip per core |
| Secondary Cache: | 256 KB I+D on chip per core |
| Tertiary Cache: | 12 MB I+D on chip per chip |
| Other Cache: | None |
| Memory Amount (GB): | 24 |
| # and size of DIMM: | 6 x 4096 MB |
| Memory Details: | 4GB 2Rx4 PC3L-10600R ECC CL9 ; slots Memory0,1,2,3,4, and 5 populated |
| Power Supply Quantity and Rating (W): | None |
| Power Supply Details: | Shared |
| Disk Drive: | 1 x 32GB SSD SATA (Hitachi P/N: GG-UH9N32DN1EX) |
| Disk Controller: | Integrated SAS controller |
| # and type of Network Interface Cards (NICs) Installed: | 2 x Intel 82575EB Gigabit Network Connection (onboard) |
| NICs Enabled in Firmware / OS / Connected: | 2/1/1 |
| Network Speed (Mbit): | 1000 |
| Keyboard: | None |
| Mouse: | None |
| Monitor: | None |
| Optical Drives: | No |
| Other Hardware: | None |
| Software | |
|---|---|
| Power Management: | Enabled (Power saver) |
| Operating System (OS): | Microsoft Windows Server 2008 R2 Enterprise |
| OS Version: | R2 |
| Filesystem: | NTFS |
| JVM Vendor: | IBM Corporation |
| JVM Version: | IBM J9 VM (build 2.4, JRE 1.6.0 IBM J9 2.4 Windows Server 2008 amd64-64 jvmwa6460sr7-20100219_54049)(JIT enabled, AOT enabled) |
| JVM Command-line Options: | -Xaggressive -Xcompressedrefs -Xgcpolicy:gencon -Xmn1500 -Xms1875m -Xmx1875m -XlockReservation -Xnoloa -XtlhPrefetch -Xlp |
| JVM Affinity: | start /affinity [F,F0,F00,F000,F0000,F00000] |
| JVM Instances: | 6 |
| JVM Initial Heap (MB): | 1875 |
| JVM Maximum Heap (MB): | 1875 |
| JVM Address Bits: | 64 |
| Boot Firmware Version: | G15 |
| Management Firmware Version: | 01-51 |
| Workload Version: | SSJ 1.2.6 |
| Director Location: | Controller |
| Other Software: | IBM WebSphere Application Server V7.0 for Windows on x86-64 bit |
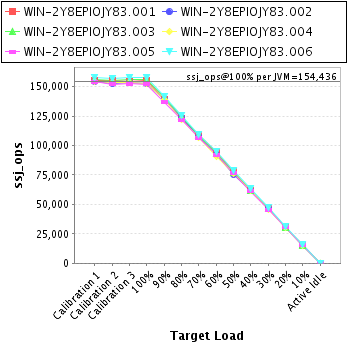
| JVM Instance | ssj_ops@100% |
|---|---|
| WIN-2Y8EPIOJY83.001 | 154,908 |
| WIN-2Y8EPIOJY83.002 | 153,099 |
| WIN-2Y8EPIOJY83.003 | 156,280 |
| WIN-2Y8EPIOJY83.004 | 152,672 |
| WIN-2Y8EPIOJY83.005 | 152,214 |
| WIN-2Y8EPIOJY83.006 | 157,442 |
| ssj_ops@100% | 926,616 |
| ssj_ops@100% per JVM | 154,436 |
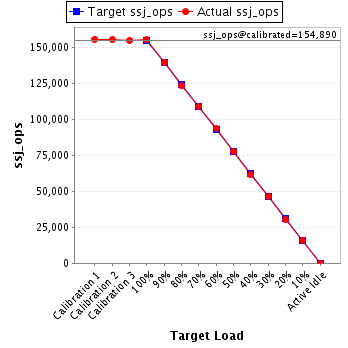
| Target Load | Actual Load | ssj_ops | |
|---|---|---|---|
| Target | Actual | ||
| Calibration 1 | 155,474 | ||
| Calibration 2 | 155,235 | ||
| Calibration 3 | 154,545 | ||
| ssj_ops@calibrated=154,890 | |||
| 100% | 100.0% | 154,890 | 154,908 |
| 90% | 90.0% | 139,401 | 139,429 |
| 80% | 79.5% | 123,912 | 123,111 |
| 70% | 70.3% | 108,423 | 108,947 |
| 60% | 60.5% | 92,934 | 93,689 |
| 50% | 50.2% | 77,445 | 77,758 |
| 40% | 39.9% | 61,956 | 61,819 |
| 30% | 30.0% | 46,467 | 46,494 |
| 20% | 19.8% | 30,978 | 30,609 |
| 10% | 10.3% | 15,489 | 15,916 |
| Active Idle | 0 | 0 | |
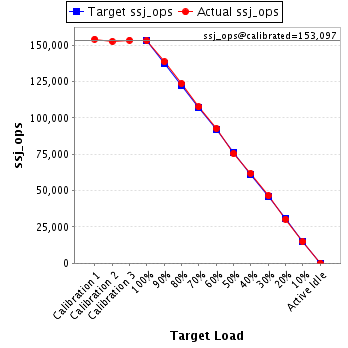
| Target Load | Actual Load | ssj_ops | |
|---|---|---|---|
| Target | Actual | ||
| Calibration 1 | 154,201 | ||
| Calibration 2 | 152,666 | ||
| Calibration 3 | 153,528 | ||
| ssj_ops@calibrated=153,097 | |||
| 100% | 100.0% | 153,097 | 153,099 |
| 90% | 90.6% | 137,787 | 138,685 |
| 80% | 80.8% | 122,478 | 123,726 |
| 70% | 70.3% | 107,168 | 107,576 |
| 60% | 60.6% | 91,858 | 92,705 |
| 50% | 49.3% | 76,549 | 75,418 |
| 40% | 40.4% | 61,239 | 61,827 |
| 30% | 30.3% | 45,929 | 46,420 |
| 20% | 19.8% | 30,619 | 30,341 |
| 10% | 9.7% | 15,310 | 14,894 |
| Active Idle | 0 | 0 | |
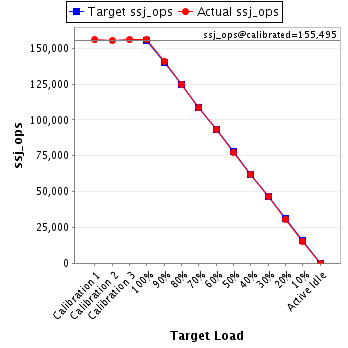
| Target Load | Actual Load | ssj_ops | |
|---|---|---|---|
| Target | Actual | ||
| Calibration 1 | 155,846 | ||
| Calibration 2 | 155,151 | ||
| Calibration 3 | 155,839 | ||
| ssj_ops@calibrated=155,495 | |||
| 100% | 100.5% | 155,495 | 156,280 |
| 90% | 90.5% | 139,946 | 140,682 |
| 80% | 80.1% | 124,396 | 124,589 |
| 70% | 69.7% | 108,847 | 108,346 |
| 60% | 60.2% | 93,297 | 93,534 |
| 50% | 49.8% | 77,748 | 77,458 |
| 40% | 39.8% | 62,198 | 61,868 |
| 30% | 29.9% | 46,649 | 46,452 |
| 20% | 19.8% | 31,099 | 30,750 |
| 10% | 10.0% | 15,550 | 15,486 |
| Active Idle | 0 | 0 | |
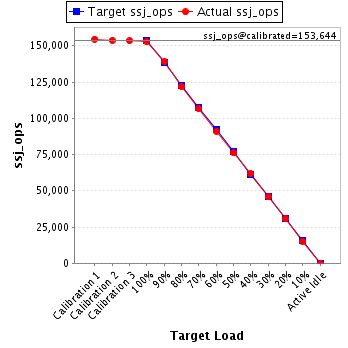
| Target Load | Actual Load | ssj_ops | |
|---|---|---|---|
| Target | Actual | ||
| Calibration 1 | 154,573 | ||
| Calibration 2 | 153,779 | ||
| Calibration 3 | 153,509 | ||
| ssj_ops@calibrated=153,644 | |||
| 100% | 99.4% | 153,644 | 152,672 |
| 90% | 90.5% | 138,279 | 138,994 |
| 80% | 79.2% | 122,915 | 121,730 |
| 70% | 69.4% | 107,551 | 106,655 |
| 60% | 59.3% | 92,186 | 91,083 |
| 50% | 49.5% | 76,822 | 76,079 |
| 40% | 40.2% | 61,458 | 61,701 |
| 30% | 29.8% | 46,093 | 45,736 |
| 20% | 19.9% | 30,729 | 30,623 |
| 10% | 9.9% | 15,364 | 15,273 |
| Active Idle | 0 | 0 | |
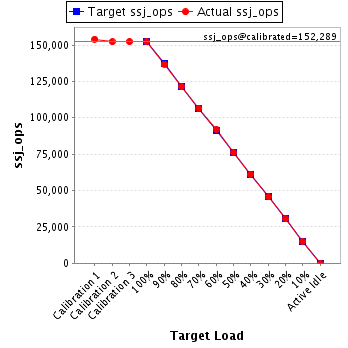
| Target Load | Actual Load | ssj_ops | |
|---|---|---|---|
| Target | Actual | ||
| Calibration 1 | 154,062 | ||
| Calibration 2 | 152,233 | ||
| Calibration 3 | 152,345 | ||
| ssj_ops@calibrated=152,289 | |||
| 100% | 100.0% | 152,289 | 152,214 |
| 90% | 89.9% | 137,060 | 136,895 |
| 80% | 79.9% | 121,831 | 121,705 |
| 70% | 70.1% | 106,603 | 106,729 |
| 60% | 60.5% | 91,374 | 92,132 |
| 50% | 50.1% | 76,145 | 76,248 |
| 40% | 40.2% | 60,916 | 61,233 |
| 30% | 29.9% | 45,687 | 45,588 |
| 20% | 20.1% | 30,458 | 30,552 |
| 10% | 9.9% | 15,229 | 15,137 |
| Active Idle | 0 | 0 | |
| Target Load | Actual Load | ssj_ops | |
|---|---|---|---|
| Target | Actual | ||
| Calibration 1 | 158,034 | ||
| Calibration 2 | 156,564 | ||
| Calibration 3 | 157,525 | ||
| ssj_ops@calibrated=157,044 | |||
| 100% | 100.3% | 157,044 | 157,442 |
| 90% | 90.0% | 141,340 | 141,351 |
| 80% | 80.0% | 125,636 | 125,613 |
| 70% | 69.8% | 109,931 | 109,623 |
| 60% | 60.4% | 94,227 | 94,837 |
| 50% | 49.9% | 78,522 | 78,390 |
| 40% | 40.2% | 62,818 | 63,199 |
| 30% | 30.4% | 47,113 | 47,732 |
| 20% | 19.9% | 31,409 | 31,278 |
| 10% | 10.0% | 15,704 | 15,662 |
| Active Idle | 0 | 0 | |
