SPECpower_ssj2008
Host 'Node04' Performance Report
Copyright © 2007-2018 Standard Performance Evaluation Corporation
| Hewlett Packard Enterprise Synergy 660 Gen10 Compute Module | ssj_ops@100% = 11,602,013 ssj_ops@100% per JVM = 1,450,252 |
||||
| Test Sponsor: | Hewlett Packard Enterprise | SPEC License #: | 3 | Test Method: | Multi Node |
| Tested By: | Hewlett Packard Enterprise | Test Location: | Houston, TX, USA | Test Date: | Apr 10, 2018 |
| Hardware Availability: | Jun-2018 | Software Availability: | Mar-2018 | Publication: | Apr 26, 2018 |
| System Source: | Single Supplier | System Designation: | Server | Power Provisioning: | Line-powered |
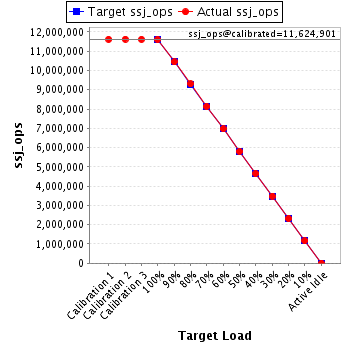
| Target Load | Actual Load | ssj_ops | |
|---|---|---|---|
| Target | Actual | ||
| Calibration 1 | 11,622,810 | ||
| Calibration 2 | 11,627,404 | ||
| Calibration 3 | 11,622,399 | ||
| ssj_ops@calibrated=11,624,901 | |||
| 100% | 99.8% | 11,624,901 | 11,602,013 |
| 90% | 89.8% | 10,462,411 | 10,444,829 |
| 80% | 80.0% | 9,299,921 | 9,301,328 |
| 70% | 70.0% | 8,137,431 | 8,137,746 |
| 60% | 60.0% | 6,974,941 | 6,971,770 |
| 50% | 49.9% | 5,812,451 | 5,806,454 |
| 40% | 40.0% | 4,649,961 | 4,649,190 |
| 30% | 30.0% | 3,487,470 | 3,488,358 |
| 20% | 20.0% | 2,324,980 | 2,325,127 |
| 10% | 10.0% | 1,162,490 | 1,163,854 |
| Active Idle | 0 | 0 | |
| Set Identifier: | SUT |
| Set Description: | System Under Test |
| # of Identical Nodes: | 6 |
| Comment: | SUT |
| Hardware | |
|---|---|
| Hardware Vendor: | Hewlett Packard Enterprise |
| Model: | Synergy 660 Gen10 Compute Module |
| Form Factor: | Other |
| CPU Name: | Intel Xeon Platinum 8180 2.50GHz |
| CPU Characteristics: | 28-Core, 2.50 GHz, 38.5MB L3 Cache |
| CPU Frequency (MHz): | 2500 |
| CPU(s) Enabled: | 112 cores, 4 chips, 28 cores/chip |
| Hardware Threads: | 224 (2 / core) |
| CPU(s) Orderable: | 1,2,3,4 chips |
| Primary Cache: | 32 KB I + 32 KB D on chip per core |
| Secondary Cache: | 1 MB I+D on chip per core |
| Tertiary Cache: | 39424 KB I+D on chip per chip |
| Other Cache: | None |
| Memory Amount (GB): | 384 |
| # and size of DIMM: | 24 x 16384 MB |
| Memory Details: | 24 x 16GB 2Rx8 PC4-2666-V ECC; slots 1, 3, 5, 8, 10 and 12 populated on each CPU socket |
| Power Supply Quantity and Rating (W): | None |
| Power Supply Details: | Shared |
| Disk Drive: | 1 x HPE 480GB SATA 6G Read Intensive M.2 (875319-B21) |
| Disk Controller: | 1 x HPE Smart Array S100i SR Gen10 |
| # and type of Network Interface Cards (NICs) Installed: | 1 x HPE Synergy 3820C 10/20Gb 2-port Converged Network Adapter (777430-B21) |
| NICs Enabled in Firmware / OS / Connected: | 2/1/1 |
| Network Speed (Mbit): | 10000 |
| Keyboard: | None |
| Mouse: | None |
| Monitor: | None |
| Optical Drives: | No |
| Other Hardware: | None |
| Software | |
|---|---|
| Power Management: | Enabled (see SUT Notes) |
| Operating System (OS): | Windows Server 2012 R2 Datacenter |
| OS Version: | Version 6.3 (Build 9600) |
| Filesystem: | NTFS |
| JVM Vendor: | Oracle Corporation |
| JVM Version: | Oracle Java HotSpot(TM) 64-Bit Server VM (build 24.80-b11, mixed mode), version 1.7.0_80 |
| JVM Command-line Options: | -server -Xmn19g -Xms21g -Xmx21g -XX:SurvivorRatio=1 -XX:TargetSurvivorRatio=99 -XX:AllocatePrefetchDistance=256 -XX:AllocatePrefetchLines=4 -XX:LoopUnrollLimit=30 -XX:InitialTenuringThreshold=12 -XX:MaxTenuringThreshold=15 -XX:ParallelGCThreads=28 -XX:InlineSmallCode=3900 -XX:MaxInlineSize=270 -XX:FreqInlineSize=2500 -XX:+AggressiveOpts -XX:+UseLargePages -XX:+UseParallelOldGC |
| JVM Affinity: | start /NODE [0,2,4,6] /AFFINITY [0x0000000FC0FF, 0xFC0FF0000000]; start /NODE [1,3,5,7] /AFFINITY [0x0000000FF03F,0xFF03F0000000] |
| JVM Instances: | 8 |
| JVM Initial Heap (MB): | 21000 |
| JVM Maximum Heap (MB): | 21000 |
| JVM Address Bits: | 64 |
| Boot Firmware Version: | I43 v1.32 (02/01/2018) |
| Management Firmware Version: | 1.15 August 17 2017 |
| Workload Version: | SSJ 1.2.10 |
| Director Location: | Controller |
| Other Software: | HPE Composer Version 3.10.07 (HPE OneView) with HPE Synergy Custom SPP Bundle 2017.10.20180323; Microsoft Windows KB4054519, KB4056898 |
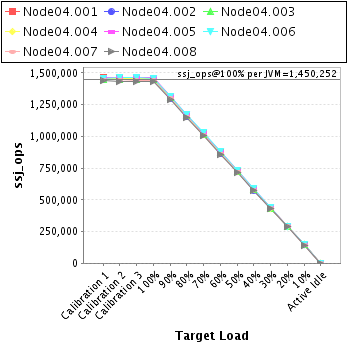
| JVM Instance | ssj_ops@100% |
|---|---|
| Node04.001 | 1,456,517 |
| Node04.002 | 1,447,819 |
| Node04.003 | 1,446,587 |
| Node04.004 | 1,452,445 |
| Node04.005 | 1,464,503 |
| Node04.006 | 1,459,583 |
| Node04.007 | 1,441,947 |
| Node04.008 | 1,432,611 |
| ssj_ops@100% | 11,602,013 |
| ssj_ops@100% per JVM | 1,450,252 |
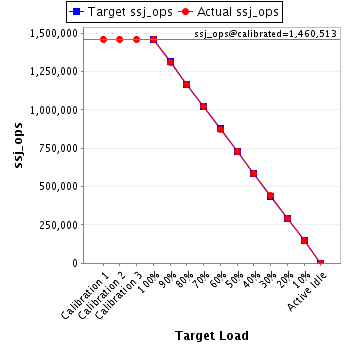
| Target Load | Actual Load | ssj_ops | |
|---|---|---|---|
| Target | Actual | ||
| Calibration 1 | 1,460,882 | ||
| Calibration 2 | 1,461,079 | ||
| Calibration 3 | 1,459,947 | ||
| ssj_ops@calibrated=1,460,513 | |||
| 100% | 99.7% | 1,460,513 | 1,456,517 |
| 90% | 89.8% | 1,314,462 | 1,311,878 |
| 80% | 79.9% | 1,168,411 | 1,166,347 |
| 70% | 69.9% | 1,022,359 | 1,021,497 |
| 60% | 59.8% | 876,308 | 874,050 |
| 50% | 50.1% | 730,257 | 731,515 |
| 40% | 40.0% | 584,205 | 583,886 |
| 30% | 30.1% | 438,154 | 439,483 |
| 20% | 20.0% | 292,103 | 291,763 |
| 10% | 10.1% | 146,051 | 147,669 |
| Active Idle | 0 | 0 | |
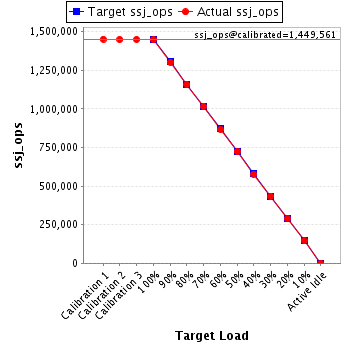
| Target Load | Actual Load | ssj_ops | |
|---|---|---|---|
| Target | Actual | ||
| Calibration 1 | 1,451,535 | ||
| Calibration 2 | 1,449,491 | ||
| Calibration 3 | 1,449,630 | ||
| ssj_ops@calibrated=1,449,561 | |||
| 100% | 99.9% | 1,449,561 | 1,447,819 |
| 90% | 89.8% | 1,304,604 | 1,301,920 |
| 80% | 80.0% | 1,159,648 | 1,159,230 |
| 70% | 70.0% | 1,014,692 | 1,014,698 |
| 60% | 59.9% | 869,736 | 868,100 |
| 50% | 50.0% | 724,780 | 724,533 |
| 40% | 39.8% | 579,824 | 577,386 |
| 30% | 30.0% | 434,868 | 435,554 |
| 20% | 20.0% | 289,912 | 289,408 |
| 10% | 10.0% | 144,956 | 144,715 |
| Active Idle | 0 | 0 | |
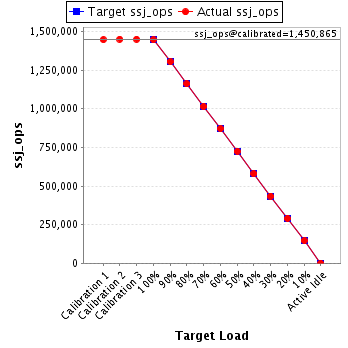
| Target Load | Actual Load | ssj_ops | |
|---|---|---|---|
| Target | Actual | ||
| Calibration 1 | 1,446,890 | ||
| Calibration 2 | 1,450,885 | ||
| Calibration 3 | 1,450,845 | ||
| ssj_ops@calibrated=1,450,865 | |||
| 100% | 99.7% | 1,450,865 | 1,446,587 |
| 90% | 89.9% | 1,305,779 | 1,304,974 |
| 80% | 80.1% | 1,160,692 | 1,161,725 |
| 70% | 70.0% | 1,015,606 | 1,015,664 |
| 60% | 60.0% | 870,519 | 871,032 |
| 50% | 50.0% | 725,433 | 724,856 |
| 40% | 39.9% | 580,346 | 578,706 |
| 30% | 30.0% | 435,260 | 435,273 |
| 20% | 20.0% | 290,173 | 290,554 |
| 10% | 10.1% | 145,087 | 146,746 |
| Active Idle | 0 | 0 | |
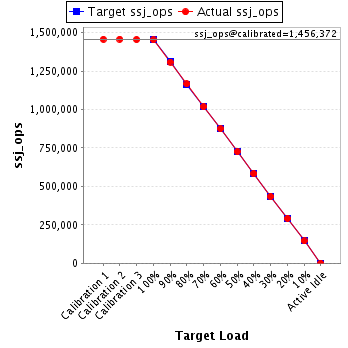
| Target Load | Actual Load | ssj_ops | |
|---|---|---|---|
| Target | Actual | ||
| Calibration 1 | 1,457,155 | ||
| Calibration 2 | 1,457,694 | ||
| Calibration 3 | 1,455,050 | ||
| ssj_ops@calibrated=1,456,372 | |||
| 100% | 99.7% | 1,456,372 | 1,452,445 |
| 90% | 89.9% | 1,310,735 | 1,309,059 |
| 80% | 80.1% | 1,165,098 | 1,166,782 |
| 70% | 69.9% | 1,019,460 | 1,018,449 |
| 60% | 60.0% | 873,823 | 874,199 |
| 50% | 49.8% | 728,186 | 725,171 |
| 40% | 40.0% | 582,549 | 582,042 |
| 30% | 29.8% | 436,912 | 434,082 |
| 20% | 20.0% | 291,274 | 291,259 |
| 10% | 9.9% | 145,637 | 144,816 |
| Active Idle | 0 | 0 | |
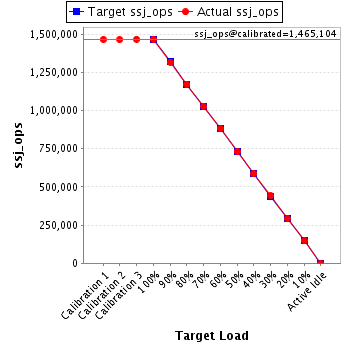
| Target Load | Actual Load | ssj_ops | |
|---|---|---|---|
| Target | Actual | ||
| Calibration 1 | 1,464,546 | ||
| Calibration 2 | 1,463,641 | ||
| Calibration 3 | 1,466,568 | ||
| ssj_ops@calibrated=1,465,104 | |||
| 100% | 100.0% | 1,465,104 | 1,464,503 |
| 90% | 89.8% | 1,318,594 | 1,315,595 |
| 80% | 80.1% | 1,172,083 | 1,173,031 |
| 70% | 70.0% | 1,025,573 | 1,026,086 |
| 60% | 60.1% | 879,063 | 880,191 |
| 50% | 49.9% | 732,552 | 730,894 |
| 40% | 40.0% | 586,042 | 585,355 |
| 30% | 30.1% | 439,531 | 440,765 |
| 20% | 20.0% | 293,021 | 292,476 |
| 10% | 10.0% | 146,510 | 146,854 |
| Active Idle | 0 | 0 | |
| Target Load | Actual Load | ssj_ops | |
|---|---|---|---|
| Target | Actual | ||
| Calibration 1 | 1,459,394 | ||
| Calibration 2 | 1,463,725 | ||
| Calibration 3 | 1,462,146 | ||
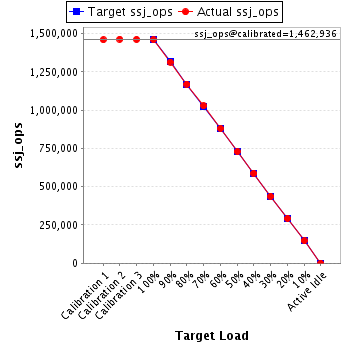
| ssj_ops@calibrated=1,462,936 | |||
| 100% | 99.8% | 1,462,936 | 1,459,583 |
| 90% | 89.8% | 1,316,642 | 1,314,200 |
| 80% | 80.0% | 1,170,349 | 1,170,062 |
| 70% | 70.3% | 1,024,055 | 1,027,736 |
| 60% | 60.2% | 877,761 | 880,890 |
| 50% | 49.8% | 731,468 | 729,104 |
| 40% | 40.1% | 585,174 | 587,019 |
| 30% | 29.9% | 438,881 | 438,107 |
| 20% | 20.0% | 292,587 | 292,217 |
| 10% | 10.0% | 146,294 | 147,006 |
| Active Idle | 0 | 0 | |
| Target Load | Actual Load | ssj_ops | |
|---|---|---|---|
| Target | Actual | ||
| Calibration 1 | 1,445,784 | ||
| Calibration 2 | 1,447,115 | ||
| Calibration 3 | 1,442,452 | ||
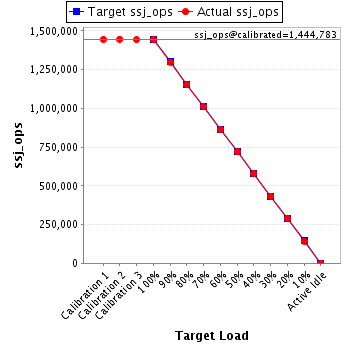
| ssj_ops@calibrated=1,444,783 | |||
| 100% | 99.8% | 1,444,783 | 1,441,947 |
| 90% | 89.9% | 1,300,305 | 1,299,370 |
| 80% | 79.9% | 1,155,827 | 1,154,396 |
| 70% | 69.9% | 1,011,348 | 1,009,448 |
| 60% | 59.8% | 866,870 | 864,141 |
| 50% | 50.0% | 722,392 | 722,650 |
| 40% | 40.0% | 577,913 | 577,420 |
| 30% | 30.0% | 433,435 | 433,097 |
| 20% | 20.1% | 288,957 | 290,619 |
| 10% | 9.9% | 144,478 | 143,606 |
| Active Idle | 0 | 0 | |
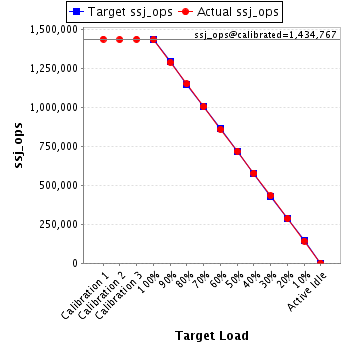
| Target Load | Actual Load | ssj_ops | |
|---|---|---|---|
| Target | Actual | ||
| Calibration 1 | 1,436,626 | ||
| Calibration 2 | 1,433,773 | ||
| Calibration 3 | 1,435,761 | ||
| ssj_ops@calibrated=1,434,767 | |||
| 100% | 99.8% | 1,434,767 | 1,432,611 |
| 90% | 89.8% | 1,291,290 | 1,287,832 |
| 80% | 80.1% | 1,147,814 | 1,149,754 |
| 70% | 70.0% | 1,004,337 | 1,004,169 |
| 60% | 59.9% | 860,860 | 859,166 |
| 50% | 50.0% | 717,383 | 717,732 |
| 40% | 40.2% | 573,907 | 577,377 |
| 30% | 30.1% | 430,430 | 431,996 |
| 20% | 20.0% | 286,953 | 286,832 |
| 10% | 9.9% | 143,477 | 142,441 |
| Active Idle | 0 | 0 | |