SPECpower_ssj2008
Host 'Node04' Performance Report
Copyright © 2007-2018 Standard Performance Evaluation Corporation
| Hewlett Packard Enterprise Synergy 660 Gen10 Compute Module | ssj_ops@100% = 11,514,316 ssj_ops@100% per JVM = 1,439,289 |
||||
| Test Sponsor: | Hewlett Packard Enterprise | SPEC License #: | 3 | Test Method: | Multi Node |
| Tested By: | Hewlett Packard Enterprise | Test Location: | Houston, TX, USA | Test Date: | Aug 27, 2018 |
| Hardware Availability: | Jun-2018 | Software Availability: | Mar-2018 | Publication: | Sep 12, 2018 |
| System Source: | Single Supplier | System Designation: | Server | Power Provisioning: | Line-powered |
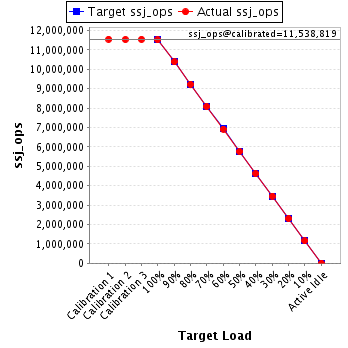
| Target Load | Actual Load | ssj_ops | |
|---|---|---|---|
| Target | Actual | ||
| Calibration 1 | 11,550,418 | ||
| Calibration 2 | 11,533,988 | ||
| Calibration 3 | 11,543,651 | ||
| ssj_ops@calibrated=11,538,819 | |||
| 100% | 99.8% | 11,538,819 | 11,514,316 |
| 90% | 90.0% | 10,384,937 | 10,379,387 |
| 80% | 80.0% | 9,231,056 | 9,229,443 |
| 70% | 70.0% | 8,077,174 | 8,077,902 |
| 60% | 60.0% | 6,923,292 | 6,918,804 |
| 50% | 49.9% | 5,769,410 | 5,760,928 |
| 40% | 40.0% | 4,615,528 | 4,617,987 |
| 30% | 30.0% | 3,461,646 | 3,463,644 |
| 20% | 20.0% | 2,307,764 | 2,307,464 |
| 10% | 10.0% | 1,153,882 | 1,152,273 |
| Active Idle | 0 | 0 | |
| Set Identifier: | SUT |
| Set Description: | System Under Test |
| # of Identical Nodes: | 3 |
| Comment: | SUT |
| Hardware | |
|---|---|
| Hardware Vendor: | Hewlett Packard Enterprise |
| Model: | Synergy 660 Gen10 Compute Module |
| Form Factor: | Other |
| CPU Name: | Intel Xeon Platinum 8180 2.50GHz |
| CPU Characteristics: | 28-Core, 2.50 GHz, 38.5MB L3 Cache |
| CPU Frequency (MHz): | 2500 |
| CPU(s) Enabled: | 112 cores, 4 chips, 28 cores/chip |
| Hardware Threads: | 224 (2 / core) |
| CPU(s) Orderable: | 1,2,3,4 chips |
| Primary Cache: | 32 KB I + 32 KB D on chip per core |
| Secondary Cache: | 1 MB I+D on chip per core |
| Tertiary Cache: | 39424 KB I+D on chip per chip |
| Other Cache: | None |
| Memory Amount (GB): | 384 |
| # and size of DIMM: | 24 x 16384 MB |
| Memory Details: | 24 x 16GB 2Rx8 PC4-2666-V ECC; slots 1, 3, 5, 8, 10 and 12 populated on each CPU socket |
| Power Supply Quantity and Rating (W): | None |
| Power Supply Details: | Shared |
| Disk Drive: | 1 x HPE 480GB SATA 6G Read Intensive M.2 (875319-B21) |
| Disk Controller: | 1 x HPE Smart Array S100i SR Gen10 (784308-B21) |
| # and type of Network Interface Cards (NICs) Installed: | 1 x HPE Synergy 3820C 10/20Gb 2-port Converged Network Adapter (777430-B21) |
| NICs Enabled in Firmware / OS / Connected: | 2/1/1 |
| Network Speed (Mbit): | 10000 |
| Keyboard: | None |
| Mouse: | None |
| Monitor: | None |
| Optical Drives: | No |
| Other Hardware: | None |
| Software | |
|---|---|
| Power Management: | Enabled (see SUT Notes) |
| Operating System (OS): | Windows Server 2012 R2 Datacenter |
| OS Version: | Version 6.3 (Build 9600) |
| Filesystem: | NTFS |
| JVM Vendor: | Oracle Corporation |
| JVM Version: | Oracle Java HotSpot(TM) 64-Bit Server VM (build 24.80-b11, mixed mode), version 1.7.0_80 |
| JVM Command-line Options: | -server -Xmn19g -Xms21g -Xmx21g -XX:SurvivorRatio=1 -XX:TargetSurvivorRatio=99 -XX:AllocatePrefetchDistance=256 -XX:AllocatePrefetchLines=4 -XX:LoopUnrollLimit=30 -XX:InitialTenuringThreshold=12 -XX:MaxTenuringThreshold=15 -XX:ParallelGCThreads=28 -XX:InlineSmallCode=3900 -XX:MaxInlineSize=270 -XX:FreqInlineSize=2500 -XX:+AggressiveOpts -XX:+UseLargePages -XX:+UseParallelOldGC |
| JVM Affinity: | start /NODE [0,2,4,6] /AFFINITY [0x0000000FC0FF, 0xFC0FF0000000]; start /NODE [1,3,5,7] /AFFINITY [0x0000000FF03F,0xFF03F0000000] |
| JVM Instances: | 8 |
| JVM Initial Heap (MB): | 21000 |
| JVM Maximum Heap (MB): | 21000 |
| JVM Address Bits: | 64 |
| Boot Firmware Version: | I43 v1.32 (02/01/2018) |
| Management Firmware Version: | 1.15 August 17 2017 |
| Workload Version: | SSJ 1.2.10 |
| Director Location: | Controller |
| Other Software: | HPE Composer Version 3.10.07 (HPE OneView) with HPE Synergy Custom SPP Bundle 2017.10.20180323; Microsoft Windows KB4054519, KB4056898 |
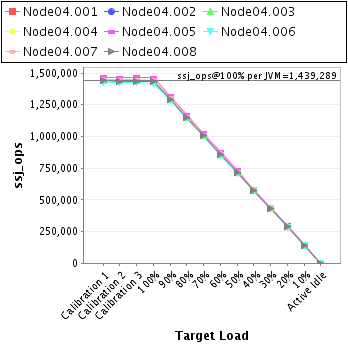
| JVM Instance | ssj_ops@100% |
|---|---|
| Node04.001 | 1,439,343 |
| Node04.002 | 1,436,579 |
| Node04.003 | 1,434,550 |
| Node04.004 | 1,439,893 |
| Node04.005 | 1,461,895 |
| Node04.006 | 1,421,518 |
| Node04.007 | 1,444,799 |
| Node04.008 | 1,435,739 |
| ssj_ops@100% | 11,514,316 |
| ssj_ops@100% per JVM | 1,439,289 |
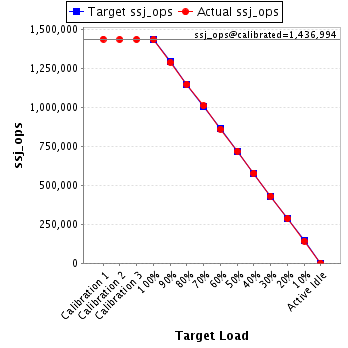
| Target Load | Actual Load | ssj_ops | |
|---|---|---|---|
| Target | Actual | ||
| Calibration 1 | 1,440,350 | ||
| Calibration 2 | 1,440,550 | ||
| Calibration 3 | 1,444,213 | ||
| ssj_ops@calibrated=1,442,382 | |||
| 100% | 99.8% | 1,442,382 | 1,439,343 |
| 90% | 90.0% | 1,298,144 | 1,298,737 |
| 80% | 80.1% | 1,153,905 | 1,154,961 |
| 70% | 69.8% | 1,009,667 | 1,007,328 |
| 60% | 59.8% | 865,429 | 862,127 |
| 50% | 49.9% | 721,191 | 720,291 |
| 40% | 40.0% | 576,953 | 576,872 |
| 30% | 30.1% | 432,715 | 433,539 |
| 20% | 20.0% | 288,476 | 288,952 |
| 10% | 10.0% | 144,238 | 144,022 |
| Active Idle | 0 | 0 | |
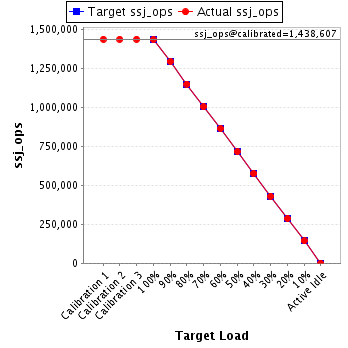
| Target Load | Actual Load | ssj_ops | |
|---|---|---|---|
| Target | Actual | ||
| Calibration 1 | 1,438,613 | ||
| Calibration 2 | 1,438,155 | ||
| Calibration 3 | 1,439,059 | ||
| ssj_ops@calibrated=1,438,607 | |||
| 100% | 99.9% | 1,438,607 | 1,436,579 |
| 90% | 90.1% | 1,294,746 | 1,296,066 |
| 80% | 80.0% | 1,150,885 | 1,151,045 |
| 70% | 69.8% | 1,007,025 | 1,004,312 |
| 60% | 60.1% | 863,164 | 864,550 |
| 50% | 49.8% | 719,303 | 716,861 |
| 40% | 40.0% | 575,443 | 576,081 |
| 30% | 30.0% | 431,582 | 431,170 |
| 20% | 20.0% | 287,721 | 288,052 |
| 10% | 10.0% | 143,861 | 143,442 |
| Active Idle | 0 | 0 | |
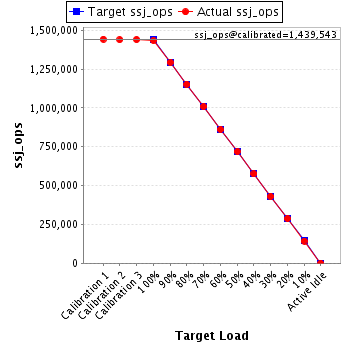
| Target Load | Actual Load | ssj_ops | |
|---|---|---|---|
| Target | Actual | ||
| Calibration 1 | 1,442,975 | ||
| Calibration 2 | 1,439,120 | ||
| Calibration 3 | 1,439,965 | ||
| ssj_ops@calibrated=1,439,543 | |||
| 100% | 99.7% | 1,439,543 | 1,434,550 |
| 90% | 89.9% | 1,295,588 | 1,294,200 |
| 80% | 80.1% | 1,151,634 | 1,152,626 |
| 70% | 70.1% | 1,007,680 | 1,009,271 |
| 60% | 59.9% | 863,726 | 861,821 |
| 50% | 49.9% | 719,771 | 718,651 |
| 40% | 39.9% | 575,817 | 575,019 |
| 30% | 29.9% | 431,863 | 430,730 |
| 20% | 20.0% | 287,909 | 287,199 |
| 10% | 9.9% | 143,954 | 142,959 |
| Active Idle | 0 | 0 | |
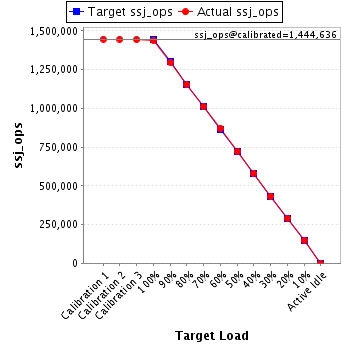
| Target Load | Actual Load | ssj_ops | |
|---|---|---|---|
| Target | Actual | ||
| Calibration 1 | 1,446,955 | ||
| Calibration 2 | 1,445,670 | ||
| Calibration 3 | 1,443,602 | ||
| ssj_ops@calibrated=1,444,636 | |||
| 100% | 99.7% | 1,444,636 | 1,439,893 |
| 90% | 89.8% | 1,300,172 | 1,297,822 |
| 80% | 79.9% | 1,155,709 | 1,154,522 |
| 70% | 70.0% | 1,011,245 | 1,010,748 |
| 60% | 60.2% | 866,782 | 869,627 |
| 50% | 50.0% | 722,318 | 722,366 |
| 40% | 40.1% | 577,854 | 579,207 |
| 30% | 30.0% | 433,391 | 432,937 |
| 20% | 20.0% | 288,927 | 289,339 |
| 10% | 10.1% | 144,464 | 145,822 |
| Active Idle | 0 | 0 | |
| Target Load | Actual Load | ssj_ops | |
|---|---|---|---|
| Target | Actual | ||
| Calibration 1 | 1,467,768 | ||
| Calibration 2 | 1,465,009 | ||
| Calibration 3 | 1,467,661 | ||
| ssj_ops@calibrated=1,466,335 | |||
| 100% | 99.7% | 1,466,335 | 1,461,895 |
| 90% | 89.7% | 1,319,701 | 1,315,661 |
| 80% | 79.9% | 1,173,068 | 1,170,874 |
| 70% | 69.9% | 1,026,434 | 1,025,153 |
| 60% | 60.0% | 879,801 | 879,606 |
| 50% | 50.0% | 733,167 | 733,108 |
| 40% | 39.9% | 586,534 | 585,770 |
| 30% | 30.0% | 439,900 | 440,157 |
| 20% | 20.1% | 293,267 | 294,383 |
| 10% | 10.0% | 146,633 | 146,412 |
| Active Idle | 0 | 0 | |

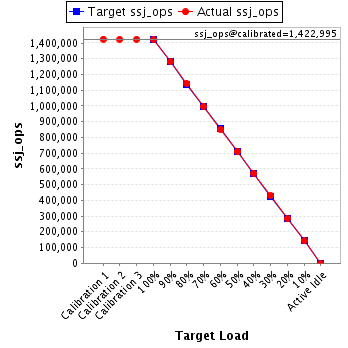
| Target Load | Actual Load | ssj_ops | |
|---|---|---|---|
| Target | Actual | ||
| Calibration 1 | 1,424,353 | ||
| Calibration 2 | 1,422,527 | ||
| Calibration 3 | 1,423,464 | ||
| ssj_ops@calibrated=1,422,995 | |||
| 100% | 99.9% | 1,422,995 | 1,421,518 |
| 90% | 90.0% | 1,280,696 | 1,281,307 |
| 80% | 80.2% | 1,138,396 | 1,141,482 |
| 70% | 70.1% | 996,097 | 997,803 |
| 60% | 59.9% | 853,797 | 852,502 |
| 50% | 49.9% | 711,498 | 709,932 |
| 40% | 40.1% | 569,198 | 571,170 |
| 30% | 30.1% | 426,899 | 428,892 |
| 20% | 19.9% | 284,599 | 283,601 |
| 10% | 10.0% | 142,300 | 142,123 |
| Active Idle | 0 | 0 | |
| Target Load | Actual Load | ssj_ops | |
|---|---|---|---|
| Target | Actual | ||
| Calibration 1 | 1,450,527 | ||
| Calibration 2 | 1,445,978 | ||
| Calibration 3 | 1,448,678 | ||
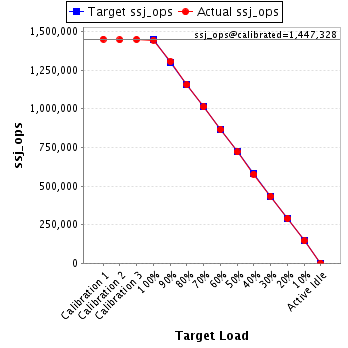
| ssj_ops@calibrated=1,447,328 | |||
| 100% | 99.8% | 1,447,328 | 1,444,799 |
| 90% | 90.2% | 1,302,595 | 1,305,785 |
| 80% | 79.8% | 1,157,862 | 1,155,237 |
| 70% | 69.9% | 1,013,130 | 1,012,172 |
| 60% | 59.9% | 868,397 | 866,804 |
| 50% | 49.8% | 723,664 | 720,450 |
| 40% | 39.8% | 578,931 | 576,760 |
| 30% | 30.0% | 434,198 | 434,422 |
| 20% | 20.0% | 289,466 | 289,581 |
| 10% | 10.0% | 144,733 | 145,387 |
| Active Idle | 0 | 0 | |
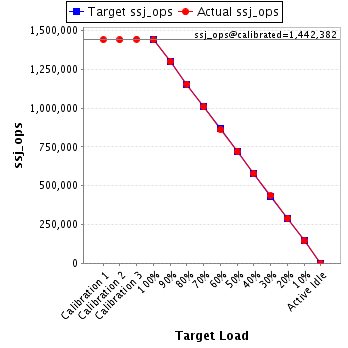
| Target Load | Actual Load | ssj_ops | |
|---|---|---|---|
| Target | Actual | ||
| Calibration 1 | 1,438,878 | ||
| Calibration 2 | 1,436,977 | ||
| Calibration 3 | 1,437,011 | ||
| ssj_ops@calibrated=1,436,994 | |||
| 100% | 99.9% | 1,436,994 | 1,435,739 |
| 90% | 89.8% | 1,293,295 | 1,289,808 |
| 80% | 79.9% | 1,149,595 | 1,148,695 |
| 70% | 70.4% | 1,005,896 | 1,011,116 |
| 60% | 60.0% | 862,196 | 861,768 |
| 50% | 50.1% | 718,497 | 719,269 |
| 40% | 40.2% | 574,798 | 577,108 |
| 30% | 30.0% | 431,098 | 431,796 |
| 20% | 19.9% | 287,399 | 286,358 |
| 10% | 9.9% | 143,699 | 142,107 |
| Active Idle | 0 | 0 | |