
SPECpower_ssj2008
Host 'Node06' Performance Report
Copyright © 2007-2018 Standard Performance Evaluation Corporation
| Hewlett Packard Enterprise Synergy 660 Gen10 Compute Module | ssj_ops@100% = 11,511,280 ssj_ops@100% per JVM = 1,438,910 |
||||
| Test Sponsor: | Hewlett Packard Enterprise | SPEC License #: | 3 | Test Method: | Multi Node |
| Tested By: | Hewlett Packard Enterprise | Test Location: | Houston, TX, USA | Test Date: | Aug 28, 2018 |
| Hardware Availability: | Jun-2018 | Software Availability: | Mar-2018 | Publication: | Sep 12, 2018 |
| System Source: | Single Supplier | System Designation: | Server | Power Provisioning: | Line-powered |
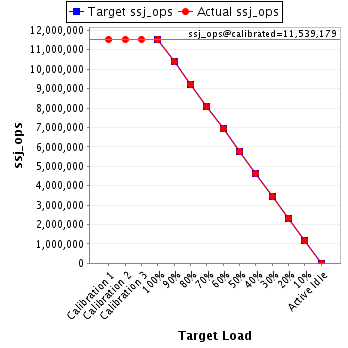
| Target Load | Actual Load | ssj_ops | |
|---|---|---|---|
| Target | Actual | ||
| Calibration 1 | 11,534,803 | ||
| Calibration 2 | 11,530,461 | ||
| Calibration 3 | 11,547,897 | ||
| ssj_ops@calibrated=11,539,179 | |||
| 100% | 99.8% | 11,539,179 | 11,511,280 |
| 90% | 89.9% | 10,385,261 | 10,379,123 |
| 80% | 80.0% | 9,231,343 | 9,234,115 |
| 70% | 70.1% | 8,077,425 | 8,085,790 |
| 60% | 60.0% | 6,923,507 | 6,926,677 |
| 50% | 50.0% | 5,769,589 | 5,770,515 |
| 40% | 40.0% | 4,615,672 | 4,612,700 |
| 30% | 30.0% | 3,461,754 | 3,461,269 |
| 20% | 20.0% | 2,307,836 | 2,307,552 |
| 10% | 10.0% | 1,153,918 | 1,153,222 |
| Active Idle | 0 | 0 | |
| Set Identifier: | SUT |
| Set Description: | System Under Test |
| # of Identical Nodes: | 2 |
| Comment: | SUT |
| Hardware | |
|---|---|
| Hardware Vendor: | Hewlett Packard Enterprise |
| Model: | Synergy 660 Gen10 Compute Module |
| Form Factor: | Other |
| CPU Name: | Intel Xeon Platinum 8180 2.50GHz |
| CPU Characteristics: | 28-Core, 2.50 GHz, 38.5MB L3 Cache |
| CPU Frequency (MHz): | 2500 |
| CPU(s) Enabled: | 112 cores, 4 chips, 28 cores/chip |
| Hardware Threads: | 224 (2 / core) |
| CPU(s) Orderable: | 1,2,3,4 chips |
| Primary Cache: | 32 KB I + 32 KB D on chip per core |
| Secondary Cache: | 1 MB I+D on chip per core |
| Tertiary Cache: | 39424 KB I+D on chip per chip |
| Other Cache: | None |
| Memory Amount (GB): | 384 |
| # and size of DIMM: | 24 x 16384 MB |
| Memory Details: | 24 x 16GB 2Rx8 PC4-2666-V ECC; slots 1, 3, 5, 8, 10 and 12 populated on each CPU socket |
| Power Supply Quantity and Rating (W): | None |
| Power Supply Details: | Shared |
| Disk Drive: | 1 x HPE 480GB SATA 6G Read Intensive M.2 (875490-B21) |
| Disk Controller: | 1 x HPE Smart Array S100i SR Gen10 (784308-B21) |
| # and type of Network Interface Cards (NICs) Installed: | 1 x HPE Synergy 3820C 10/20Gb 2-port Converged Network Adapter (777430-B21) |
| NICs Enabled in Firmware / OS / Connected: | 2/1/1 |
| Network Speed (Mbit): | 10000 |
| Keyboard: | None |
| Mouse: | None |
| Monitor: | None |
| Optical Drives: | No |
| Other Hardware: | None |
| Software | |
|---|---|
| Power Management: | Enabled (see SUT Notes) |
| Operating System (OS): | Windows Server 2012 R2 Datacenter |
| OS Version: | Version 6.3 (Build 9600) |
| Filesystem: | NTFS |
| JVM Vendor: | Oracle Corporation |
| JVM Version: | Oracle Java HotSpot(TM) 64-Bit Server VM (build 24.80-b11, mixed mode), version 1.7.0_80 |
| JVM Command-line Options: | -server -Xmn19g -Xms21g -Xmx21g -XX:SurvivorRatio=1 -XX:TargetSurvivorRatio=99 -XX:AllocatePrefetchDistance=256 -XX:AllocatePrefetchLines=4 -XX:LoopUnrollLimit=30 -XX:InitialTenuringThreshold=12 -XX:MaxTenuringThreshold=15 -XX:ParallelGCThreads=28 -XX:InlineSmallCode=3900 -XX:MaxInlineSize=270 -XX:FreqInlineSize=2500 -XX:+AggressiveOpts -XX:+UseLargePages -XX:+UseParallelOldGC |
| JVM Affinity: | start /NODE [0,2,4,6] /AFFINITY [0x0000000FC0FF, 0xFC0FF0000000]; start /NODE [1,3,5,7] /AFFINITY [0x0000000FF03F,0xFF03F0000000] |
| JVM Instances: | 8 |
| JVM Initial Heap (MB): | 21000 |
| JVM Maximum Heap (MB): | 21000 |
| JVM Address Bits: | 64 |
| Boot Firmware Version: | I43 v1.32 (02/01/2018) |
| Management Firmware Version: | 1.15 August 17 2017 |
| Workload Version: | SSJ 1.2.10 |
| Director Location: | Controller |
| Other Software: | HPE Composer Version 3.10.07 (HPE OneView) with HPE Synergy Custom SPP Bundle 2017.10.20180323; Microsoft Windows KB4054519, KB4056898 |
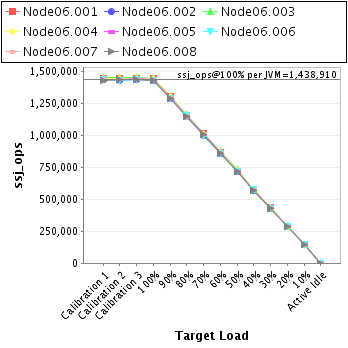
| JVM Instance | ssj_ops@100% |
|---|---|
| Node06.001 | 1,443,391 |
| Node06.002 | 1,431,357 |
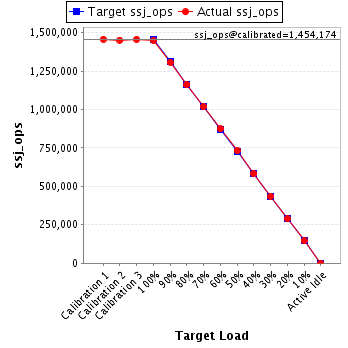
| Node06.003 | 1,450,077 |
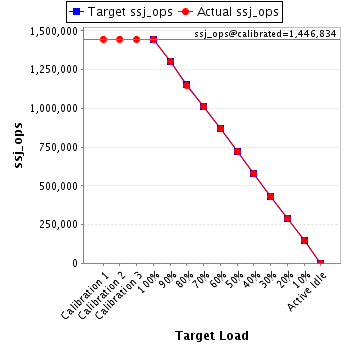
| Node06.004 | 1,444,040 |
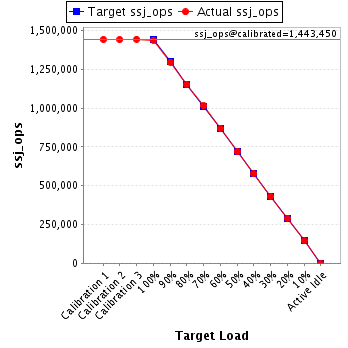
| Node06.005 | 1,438,889 |
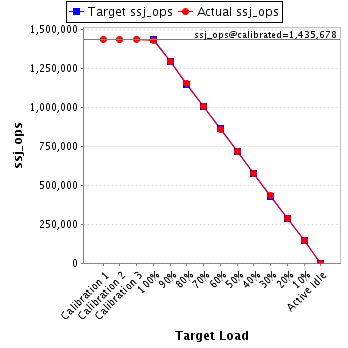
| Node06.006 | 1,431,501 |
| Node06.007 | 1,438,149 |
| Node06.008 | 1,433,875 |
| ssj_ops@100% | 11,511,280 |
| ssj_ops@100% per JVM | 1,438,910 |
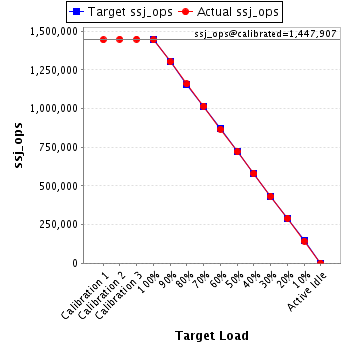
| Target Load | Actual Load | ssj_ops | |
|---|---|---|---|
| Target | Actual | ||
| Calibration 1 | 1,443,621 | ||
| Calibration 2 | 1,447,488 | ||
| Calibration 3 | 1,448,326 | ||
| ssj_ops@calibrated=1,447,907 | |||
| 100% | 99.7% | 1,447,907 | 1,443,391 |
| 90% | 89.9% | 1,303,116 | 1,302,119 |
| 80% | 80.0% | 1,158,325 | 1,158,610 |
| 70% | 70.2% | 1,013,535 | 1,016,311 |
| 60% | 59.9% | 868,744 | 867,196 |
| 50% | 49.8% | 723,953 | 720,682 |
| 40% | 39.9% | 579,163 | 578,323 |
| 30% | 29.9% | 434,372 | 433,367 |
| 20% | 20.1% | 289,581 | 290,703 |
| 10% | 9.9% | 144,791 | 143,222 |
| Active Idle | 0 | 0 | |
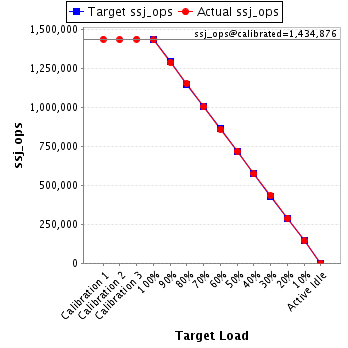
| Target Load | Actual Load | ssj_ops | |
|---|---|---|---|
| Target | Actual | ||
| Calibration 1 | 1,436,236 | ||
| Calibration 2 | 1,433,277 | ||
| Calibration 3 | 1,436,476 | ||
| ssj_ops@calibrated=1,434,876 | |||
| 100% | 99.8% | 1,434,876 | 1,431,357 |
| 90% | 89.8% | 1,291,389 | 1,288,722 |
| 80% | 80.3% | 1,147,901 | 1,151,541 |
| 70% | 69.9% | 1,004,413 | 1,002,606 |
| 60% | 60.0% | 860,926 | 860,574 |
| 50% | 50.0% | 717,438 | 717,801 |
| 40% | 39.9% | 573,950 | 572,498 |
| 30% | 30.1% | 430,463 | 431,790 |
| 20% | 20.0% | 286,975 | 287,108 |
| 10% | 10.0% | 143,488 | 143,142 |
| Active Idle | 0 | 0 | |
| Target Load | Actual Load | ssj_ops | |
|---|---|---|---|
| Target | Actual | ||
| Calibration 1 | 1,456,566 | ||
| Calibration 2 | 1,451,289 | ||
| Calibration 3 | 1,457,060 | ||
| ssj_ops@calibrated=1,454,174 | |||
| 100% | 99.7% | 1,454,174 | 1,450,077 |
| 90% | 89.9% | 1,308,757 | 1,306,897 |
| 80% | 79.9% | 1,163,340 | 1,162,032 |
| 70% | 70.0% | 1,017,922 | 1,017,642 |
| 60% | 60.0% | 872,505 | 873,009 |
| 50% | 50.3% | 727,087 | 730,733 |
| 40% | 40.0% | 581,670 | 581,293 |
| 30% | 30.0% | 436,252 | 436,135 |
| 20% | 19.8% | 290,835 | 288,263 |
| 10% | 10.1% | 145,417 | 146,248 |
| Active Idle | 0 | 0 | |
| Target Load | Actual Load | ssj_ops | |
|---|---|---|---|
| Target | Actual | ||
| Calibration 1 | 1,446,510 | ||
| Calibration 2 | 1,447,017 | ||
| Calibration 3 | 1,446,651 | ||
| ssj_ops@calibrated=1,446,834 | |||
| 100% | 99.8% | 1,446,834 | 1,444,040 |
| 90% | 90.0% | 1,302,151 | 1,302,431 |
| 80% | 79.5% | 1,157,467 | 1,149,805 |
| 70% | 69.9% | 1,012,784 | 1,011,642 |
| 60% | 60.0% | 868,100 | 868,070 |
| 50% | 50.0% | 723,417 | 723,568 |
| 40% | 40.0% | 578,734 | 579,216 |
| 30% | 30.0% | 434,050 | 434,175 |
| 20% | 20.0% | 289,367 | 288,965 |
| 10% | 10.0% | 144,683 | 144,724 |
| Active Idle | 0 | 0 | |
| Target Load | Actual Load | ssj_ops | |
|---|---|---|---|
| Target | Actual | ||
| Calibration 1 | 1,442,772 | ||
| Calibration 2 | 1,442,038 | ||
| Calibration 3 | 1,444,862 | ||
| ssj_ops@calibrated=1,443,450 | |||
| 100% | 99.7% | 1,443,450 | 1,438,889 |
| 90% | 89.9% | 1,299,105 | 1,297,475 |
| 80% | 80.1% | 1,154,760 | 1,155,588 |
| 70% | 70.2% | 1,010,415 | 1,013,998 |
| 60% | 60.3% | 866,070 | 870,524 |
| 50% | 49.9% | 721,725 | 720,704 |
| 40% | 40.0% | 577,380 | 578,081 |
| 30% | 29.9% | 433,035 | 431,256 |
| 20% | 20.1% | 288,690 | 290,095 |
| 10% | 9.9% | 144,345 | 143,591 |
| Active Idle | 0 | 0 | |
| Target Load | Actual Load | ssj_ops | |
|---|---|---|---|
| Target | Actual | ||
| Calibration 1 | 1,436,013 | ||
| Calibration 2 | 1,433,907 | ||
| Calibration 3 | 1,437,449 | ||
| ssj_ops@calibrated=1,435,678 | |||
| 100% | 99.7% | 1,435,678 | 1,431,501 |
| 90% | 90.1% | 1,292,110 | 1,293,511 |
| 80% | 80.3% | 1,148,542 | 1,153,523 |
| 70% | 70.0% | 1,004,975 | 1,004,259 |
| 60% | 60.0% | 861,407 | 861,038 |
| 50% | 50.1% | 717,839 | 718,615 |
| 40% | 40.0% | 574,271 | 574,361 |
| 30% | 30.1% | 430,703 | 431,565 |
| 20% | 20.1% | 287,136 | 287,929 |
| 10% | 10.1% | 143,568 | 144,545 |
| Active Idle | 0 | 0 | |
| Target Load | Actual Load | ssj_ops | |
|---|---|---|---|
| Target | Actual | ||
| Calibration 1 | 1,440,486 | ||
| Calibration 2 | 1,439,071 | ||
| Calibration 3 | 1,440,526 | ||
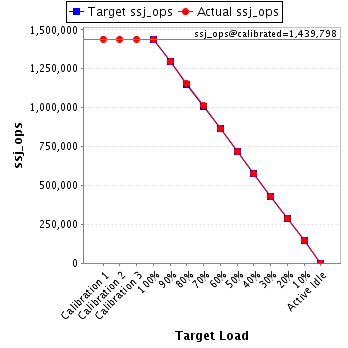
| ssj_ops@calibrated=1,439,798 | |||
| 100% | 99.9% | 1,439,798 | 1,438,149 |
| 90% | 90.1% | 1,295,818 | 1,297,414 |
| 80% | 80.2% | 1,151,839 | 1,155,235 |
| 70% | 70.4% | 1,007,859 | 1,012,966 |
| 60% | 59.9% | 863,879 | 863,158 |
| 50% | 49.9% | 719,899 | 719,058 |
| 40% | 40.0% | 575,919 | 575,601 |
| 30% | 30.0% | 431,939 | 431,512 |
| 20% | 20.0% | 287,960 | 287,516 |
| 10% | 10.0% | 143,980 | 144,321 |
| Active Idle | 0 | 0 | |
| Target Load | Actual Load | ssj_ops | |
|---|---|---|---|
| Target | Actual | ||
| Calibration 1 | 1,432,599 | ||
| Calibration 2 | 1,436,375 | ||
| Calibration 3 | 1,436,548 | ||
| ssj_ops@calibrated=1,436,461 | |||
| 100% | 99.8% | 1,436,461 | 1,433,875 |
| 90% | 89.8% | 1,292,815 | 1,290,554 |
| 80% | 79.9% | 1,149,169 | 1,147,781 |
| 70% | 70.1% | 1,005,523 | 1,006,364 |
| 60% | 60.1% | 861,877 | 863,109 |
| 50% | 50.1% | 718,231 | 719,353 |
| 40% | 39.9% | 574,585 | 573,328 |
| 30% | 30.0% | 430,938 | 431,469 |
| 20% | 20.0% | 287,292 | 286,974 |
| 10% | 10.0% | 143,646 | 143,430 |
| Active Idle | 0 | 0 | |
