
SPECpower_ssj2008
Host 'SY480-01' Performance Report
Copyright © 2007-2019 Standard Performance Evaluation Corporation
| Hewlett Packard Enterprise Synergy 480 Gen10 Compute Module | ssj_ops@100% = 5,922,566 ssj_ops@100% per JVM = 1,480,642 |
||||
| Test Sponsor: | Hewlett Packard Enterprise | SPEC License #: | 3 | Test Method: | Multi Node |
| Tested By: | Hewlett Packard Enterprise | Test Location: | Houston, TX, USA | Test Date: | Mar 12, 2019 |
| Hardware Availability: | Apr-2019 | Software Availability: | Mar-2019 | Publication: | Apr 2, 2019 |
| System Source: | Single Supplier | System Designation: | Server | Power Provisioning: | Line-powered |
| Target Load | Actual Load | ssj_ops | |
|---|---|---|---|
| Target | Actual | ||
| Calibration 1 | 5,951,167 | ||
| Calibration 2 | 5,940,636 | ||
| Calibration 3 | 5,938,045 | ||
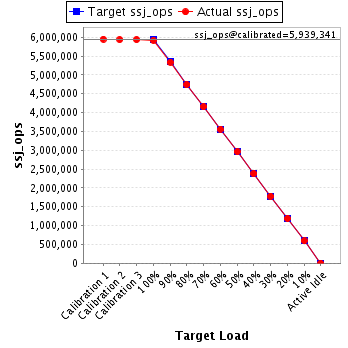
| ssj_ops@calibrated=5,939,341 | |||
| 100% | 99.7% | 5,939,341 | 5,922,566 |
| 90% | 89.9% | 5,345,407 | 5,337,889 |
| 80% | 79.9% | 4,751,473 | 4,744,887 |
| 70% | 70.0% | 4,157,538 | 4,155,917 |
| 60% | 60.0% | 3,563,604 | 3,564,694 |
| 50% | 49.8% | 2,969,670 | 2,960,046 |
| 40% | 40.0% | 2,375,736 | 2,377,244 |
| 30% | 30.0% | 1,781,802 | 1,783,046 |
| 20% | 20.0% | 1,187,868 | 1,188,857 |
| 10% | 10.0% | 593,934 | 593,908 |
| Active Idle | 0 | 0 | |
| Set Identifier: | SUT |
| Set Description: | System Under Test |
| # of Identical Nodes: | 10 |
| Comment: | SUT |
| Hardware | |
|---|---|
| Hardware Vendor: | Hewlett Packard Enterprise |
| Model: | Synergy 480 Gen10 Compute Module |
| Form Factor: | blade |
| CPU Name: | Intel Xeon Platinum 8280 @ 2.70GHz |
| CPU Characteristics: | 28-Core, 2.70 GHz, 38.5MB L3 Cache |
| CPU Frequency (MHz): | 2700 |
| CPU(s) Enabled: | 56 cores, 2 chips, 28 cores/chip |
| Hardware Threads: | 112 (2 / core) |
| CPU(s) Orderable: | 1,2 chips |
| Primary Cache: | 32 KB I + 32 KB D on chip per core |
| Secondary Cache: | 1 MB I+D on chip per core |
| Tertiary Cache: | 39424 KB I+D on chip per chip |
| Other Cache: | None |
| Memory Amount (GB): | 192 |
| # and size of DIMM: | 12 x 16384 MB |
| Memory Details: | 12 x 16GB 2Rx8 PC4-2933Y-R; slots 1, 3, 5, 8, 10 and 12 populated on each socket |
| Power Supply Quantity and Rating (W): | None |
| Power Supply Details: | N/A |
| Disk Drive: | 1 x HPE 480GB SATA 6G M.2 2280 (875498-B21) |
| Disk Controller: | HPE Smart Array S100i SR Gen10 |
| # and type of Network Interface Cards (NICs) Installed: | 1 x HPE Synergy 3820C 10/20Gb CNA |
| NICs Enabled in Firmware / OS / Connected: | 2/2/1 |
| Network Speed (Mbit): | 1000 |
| Keyboard: | None |
| Mouse: | None |
| Monitor: | None |
| Optical Drives: | No |
| Other Hardware: | None |
| Software | |
|---|---|
| Power Management: | Enabled (see SUT Notes) |
| Operating System (OS): | SUSE Linux Enterprise Server 12 SP4 |
| OS Version: | 4.12.14-94.41-default |
| Filesystem: | xfs |
| JVM Vendor: | Oracle Corporation |
| JVM Version: | Oracle Java HotSpot(TM) 64-Bit Server VM (build 24.80-b11, mixed mode), version 1.7.0_80 |
| JVM Command-line Options: | -server -Xmn19g -Xms21g -Xmx21g -XX:SurvivorRatio=1 -XX:TargetSurvivorRatio=99 -XX:AllocatePrefetchDistance=384 -XX:AllocatePrefetchLines=4 -XX:LoopUnrollLimit=37 -XX:InitialTenuringThreshold=12 -XX:MaxTenuringThreshold=15 -XX:ParallelGCThreads=28 -XX:InlineSmallCode=3900 -XX:MaxInlineSize=270 -XX:FreqInlineSize=2500 -XX:+AggressiveOpts -XX:+UseLargePages -XX:+UseParallelOldGC |
| JVM Affinity: | numactl --cpunodebind=[0-3] --localalloc |
| JVM Instances: | 4 |
| JVM Initial Heap (MB): | 21000 |
| JVM Maximum Heap (MB): | 21000 |
| JVM Address Bits: | 64 |
| Boot Firmware Version: | I42 v2.00 (02/02/2019) |
| Management Firmware Version: | 1.40 Feb 05 2019 |
| Workload Version: | SSJ 1.2.10 |
| Director Location: | Controller |
| Other Software: | HPE Service Pack for ProLiant (SPP) - Version 2019.03.0 (Mar 2019) |
| JVM Instance | ssj_ops@100% |
|---|---|
| SY480-01.001 | 1,462,438 |
| SY480-01.002 | 1,491,005 |
| SY480-01.003 | 1,491,655 |
| SY480-01.004 | 1,477,469 |
| ssj_ops@100% | 5,922,566 |
| ssj_ops@100% per JVM | 1,480,642 |

| Target Load | Actual Load | ssj_ops | |
|---|---|---|---|
| Target | Actual | ||
| Calibration 1 | 1,469,071 | ||
| Calibration 2 | 1,467,292 | ||
| Calibration 3 | 1,465,850 | ||
| ssj_ops@calibrated=1,466,571 | |||
| 100% | 99.7% | 1,466,571 | 1,462,438 |
| 90% | 90.1% | 1,319,914 | 1,321,735 |
| 80% | 79.7% | 1,173,257 | 1,168,280 |
| 70% | 69.9% | 1,026,600 | 1,025,603 |
| 60% | 60.0% | 879,943 | 880,617 |
| 50% | 49.8% | 733,286 | 730,466 |
| 40% | 39.9% | 586,629 | 585,530 |
| 30% | 30.1% | 439,971 | 440,850 |
| 20% | 20.0% | 293,314 | 293,777 |
| 10% | 10.1% | 146,657 | 147,641 |
| Active Idle | 0 | 0 | |

| Target Load | Actual Load | ssj_ops | |
|---|---|---|---|
| Target | Actual | ||
| Calibration 1 | 1,500,782 | ||
| Calibration 2 | 1,497,744 | ||
| Calibration 3 | 1,492,965 | ||
| ssj_ops@calibrated=1,495,355 | |||
| 100% | 99.7% | 1,495,355 | 1,491,005 |
| 90% | 89.9% | 1,345,819 | 1,343,917 |
| 80% | 79.9% | 1,196,284 | 1,195,268 |
| 70% | 70.0% | 1,046,748 | 1,046,448 |
| 60% | 60.1% | 897,213 | 898,569 |
| 50% | 49.9% | 747,677 | 746,686 |
| 40% | 40.1% | 598,142 | 600,364 |
| 30% | 29.9% | 448,606 | 447,004 |
| 20% | 20.0% | 299,071 | 298,582 |
| 10% | 10.0% | 149,535 | 148,990 |
| Active Idle | 0 | 0 | |

| Target Load | Actual Load | ssj_ops | |
|---|---|---|---|
| Target | Actual | ||
| Calibration 1 | 1,495,258 | ||
| Calibration 2 | 1,494,647 | ||
| Calibration 3 | 1,496,473 | ||
| ssj_ops@calibrated=1,495,560 | |||
| 100% | 99.7% | 1,495,560 | 1,491,655 |
| 90% | 89.8% | 1,346,004 | 1,342,976 |
| 80% | 80.1% | 1,196,448 | 1,197,612 |
| 70% | 70.0% | 1,046,892 | 1,046,934 |
| 60% | 60.0% | 897,336 | 897,900 |
| 50% | 49.9% | 747,780 | 746,484 |
| 40% | 40.1% | 598,224 | 599,605 |
| 30% | 30.1% | 448,668 | 449,779 |
| 20% | 20.0% | 299,112 | 299,035 |
| 10% | 10.0% | 149,556 | 149,903 |
| Active Idle | 0 | 0 | |

| Target Load | Actual Load | ssj_ops | |
|---|---|---|---|
| Target | Actual | ||
| Calibration 1 | 1,486,056 | ||
| Calibration 2 | 1,480,953 | ||
| Calibration 3 | 1,482,756 | ||
| ssj_ops@calibrated=1,481,855 | |||
| 100% | 99.7% | 1,481,855 | 1,477,469 |
| 90% | 89.7% | 1,333,669 | 1,329,262 |
| 80% | 79.9% | 1,185,484 | 1,183,727 |
| 70% | 70.0% | 1,037,298 | 1,036,931 |
| 60% | 59.9% | 889,113 | 887,609 |
| 50% | 49.7% | 740,927 | 736,409 |
| 40% | 39.9% | 592,742 | 591,744 |
| 30% | 30.1% | 444,556 | 445,412 |
| 20% | 20.1% | 296,371 | 297,463 |
| 10% | 9.9% | 148,185 | 147,374 |
| Active Idle | 0 | 0 | |
