
SPECpower_ssj2008
Host 'SY480-04' Performance Report
Copyright © 2007-2019 Standard Performance Evaluation Corporation
| Hewlett Packard Enterprise Synergy 480 Gen10 Compute Module | ssj_ops@100% = 5,918,106 ssj_ops@100% per JVM = 1,479,527 |
||||
| Test Sponsor: | Hewlett Packard Enterprise | SPEC License #: | 3 | Test Method: | Multi Node |
| Tested By: | Hewlett Packard Enterprise | Test Location: | Houston, TX, USA | Test Date: | Mar 12, 2019 |
| Hardware Availability: | Apr-2019 | Software Availability: | Mar-2019 | Publication: | Apr 2, 2019 |
| System Source: | Single Supplier | System Designation: | Server | Power Provisioning: | Line-powered |
| Target Load | Actual Load | ssj_ops | |
|---|---|---|---|
| Target | Actual | ||
| Calibration 1 | 5,937,717 | ||
| Calibration 2 | 5,934,911 | ||
| Calibration 3 | 5,937,183 | ||
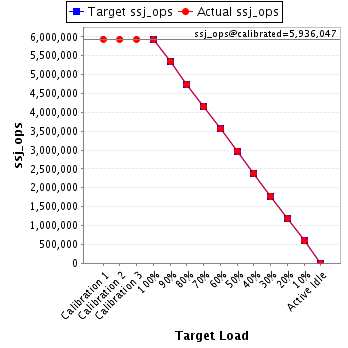
| ssj_ops@calibrated=5,936,047 | |||
| 100% | 99.7% | 5,936,047 | 5,918,106 |
| 90% | 90.1% | 5,342,442 | 5,350,072 |
| 80% | 79.9% | 4,748,837 | 4,744,970 |
| 70% | 69.9% | 4,155,233 | 4,149,463 |
| 60% | 60.0% | 3,561,628 | 3,558,741 |
| 50% | 50.0% | 2,968,023 | 2,970,535 |
| 40% | 39.9% | 2,374,419 | 2,370,693 |
| 30% | 29.9% | 1,780,814 | 1,777,207 |
| 20% | 20.0% | 1,187,209 | 1,186,451 |
| 10% | 10.0% | 593,605 | 591,653 |
| Active Idle | 0 | 0 | |
| Set Identifier: | SUT |
| Set Description: | System Under Test |
| # of Identical Nodes: | 10 |
| Comment: | SUT |
| Hardware | |
|---|---|
| Hardware Vendor: | Hewlett Packard Enterprise |
| Model: | Synergy 480 Gen10 Compute Module |
| Form Factor: | blade |
| CPU Name: | Intel Xeon Platinum 8280 @ 2.70GHz |
| CPU Characteristics: | 28-Core, 2.70 GHz, 38.5MB L3 Cache |
| CPU Frequency (MHz): | 2700 |
| CPU(s) Enabled: | 56 cores, 2 chips, 28 cores/chip |
| Hardware Threads: | 112 (2 / core) |
| CPU(s) Orderable: | 1,2 chips |
| Primary Cache: | 32 KB I + 32 KB D on chip per core |
| Secondary Cache: | 1 MB I+D on chip per core |
| Tertiary Cache: | 39424 KB I+D on chip per chip |
| Other Cache: | None |
| Memory Amount (GB): | 192 |
| # and size of DIMM: | 12 x 16384 MB |
| Memory Details: | 12 x 16GB 2Rx8 PC4-2933Y-R; slots 1, 3, 5, 8, 10 and 12 populated on each socket |
| Power Supply Quantity and Rating (W): | None |
| Power Supply Details: | N/A |
| Disk Drive: | 1 x HPE 480GB SATA 6G M.2 2280 (875498-B21) |
| Disk Controller: | HPE Smart Array S100i SR Gen10 |
| # and type of Network Interface Cards (NICs) Installed: | 1 x HPE Synergy 3820C 10/20Gb CNA |
| NICs Enabled in Firmware / OS / Connected: | 2/2/1 |
| Network Speed (Mbit): | 1000 |
| Keyboard: | None |
| Mouse: | None |
| Monitor: | None |
| Optical Drives: | No |
| Other Hardware: | None |
| Software | |
|---|---|
| Power Management: | Enabled (see SUT Notes) |
| Operating System (OS): | SUSE Linux Enterprise Server 12 SP4 |
| OS Version: | 4.12.14-94.41-default |
| Filesystem: | xfs |
| JVM Vendor: | Oracle Corporation |
| JVM Version: | Oracle Java HotSpot(TM) 64-Bit Server VM (build 24.80-b11, mixed mode), version 1.7.0_80 |
| JVM Command-line Options: | -server -Xmn19g -Xms21g -Xmx21g -XX:SurvivorRatio=1 -XX:TargetSurvivorRatio=99 -XX:AllocatePrefetchDistance=384 -XX:AllocatePrefetchLines=4 -XX:LoopUnrollLimit=37 -XX:InitialTenuringThreshold=12 -XX:MaxTenuringThreshold=15 -XX:ParallelGCThreads=28 -XX:InlineSmallCode=3900 -XX:MaxInlineSize=270 -XX:FreqInlineSize=2500 -XX:+AggressiveOpts -XX:+UseLargePages -XX:+UseParallelOldGC |
| JVM Affinity: | numactl --cpunodebind=[0-3] --localalloc |
| JVM Instances: | 4 |
| JVM Initial Heap (MB): | 21000 |
| JVM Maximum Heap (MB): | 21000 |
| JVM Address Bits: | 64 |
| Boot Firmware Version: | I42 v2.00 (02/02/2019) |
| Management Firmware Version: | 1.40 Feb 05 2019 |
| Workload Version: | SSJ 1.2.10 |
| Director Location: | Controller |
| Other Software: | HPE Service Pack for ProLiant (SPP) - Version 2019.03.0 (Mar 2019) |
| JVM Instance | ssj_ops@100% |
|---|---|
| SY480-04.001 | 1,474,874 |
| SY480-04.002 | 1,478,214 |
| SY480-04.003 | 1,492,253 |
| SY480-04.004 | 1,472,765 |
| ssj_ops@100% | 5,918,106 |
| ssj_ops@100% per JVM | 1,479,527 |

| Target Load | Actual Load | ssj_ops | |
|---|---|---|---|
| Target | Actual | ||
| Calibration 1 | 1,474,332 | ||
| Calibration 2 | 1,478,705 | ||
| Calibration 3 | 1,478,641 | ||
| ssj_ops@calibrated=1,478,673 | |||
| 100% | 99.7% | 1,478,673 | 1,474,874 |
| 90% | 90.1% | 1,330,806 | 1,332,709 |
| 80% | 80.4% | 1,182,938 | 1,189,575 |
| 70% | 69.9% | 1,035,071 | 1,033,263 |
| 60% | 59.9% | 887,204 | 886,402 |
| 50% | 50.1% | 739,337 | 740,274 |
| 40% | 39.9% | 591,469 | 590,108 |
| 30% | 29.9% | 443,602 | 441,537 |
| 20% | 20.1% | 295,735 | 297,238 |
| 10% | 10.0% | 147,867 | 148,067 |
| Active Idle | 0 | 0 | |

| Target Load | Actual Load | ssj_ops | |
|---|---|---|---|
| Target | Actual | ||
| Calibration 1 | 1,484,174 | ||
| Calibration 2 | 1,484,629 | ||
| Calibration 3 | 1,482,824 | ||
| ssj_ops@calibrated=1,483,726 | |||
| 100% | 99.6% | 1,483,726 | 1,478,214 |
| 90% | 90.3% | 1,335,354 | 1,339,277 |
| 80% | 79.9% | 1,186,981 | 1,185,207 |
| 70% | 69.9% | 1,038,608 | 1,037,238 |
| 60% | 59.9% | 890,236 | 888,259 |
| 50% | 50.0% | 741,863 | 741,595 |
| 40% | 40.1% | 593,490 | 594,587 |
| 30% | 30.0% | 445,118 | 444,502 |
| 20% | 20.1% | 296,745 | 297,583 |
| 10% | 10.0% | 148,373 | 147,652 |
| Active Idle | 0 | 0 | |

| Target Load | Actual Load | ssj_ops | |
|---|---|---|---|
| Target | Actual | ||
| Calibration 1 | 1,499,300 | ||
| Calibration 2 | 1,494,204 | ||
| Calibration 3 | 1,497,254 | ||
| ssj_ops@calibrated=1,495,729 | |||
| 100% | 99.8% | 1,495,729 | 1,492,253 |
| 90% | 90.0% | 1,346,156 | 1,346,133 |
| 80% | 79.8% | 1,196,583 | 1,192,971 |
| 70% | 69.9% | 1,047,011 | 1,045,047 |
| 60% | 60.1% | 897,438 | 898,700 |
| 50% | 50.0% | 747,865 | 748,026 |
| 40% | 40.0% | 598,292 | 597,699 |
| 30% | 30.0% | 448,719 | 449,464 |
| 20% | 19.9% | 299,146 | 298,221 |
| 10% | 9.9% | 149,573 | 148,621 |
| Active Idle | 0 | 0 | |

| Target Load | Actual Load | ssj_ops | |
|---|---|---|---|
| Target | Actual | ||
| Calibration 1 | 1,479,911 | ||
| Calibration 2 | 1,477,373 | ||
| Calibration 3 | 1,478,463 | ||
| ssj_ops@calibrated=1,477,918 | |||
| 100% | 99.7% | 1,477,918 | 1,472,765 |
| 90% | 90.1% | 1,330,126 | 1,331,953 |
| 80% | 79.7% | 1,182,335 | 1,177,218 |
| 70% | 70.0% | 1,034,543 | 1,033,915 |
| 60% | 59.9% | 886,751 | 885,380 |
| 50% | 50.1% | 738,959 | 740,640 |
| 40% | 39.8% | 591,167 | 588,300 |
| 30% | 29.9% | 443,375 | 441,704 |
| 20% | 19.9% | 295,584 | 293,410 |
| 10% | 10.0% | 147,792 | 147,314 |
| Active Idle | 0 | 0 | |
