
SPECpower_ssj2008
Host 'SY480-05' Performance Report
Copyright © 2007-2019 Standard Performance Evaluation Corporation
| Hewlett Packard Enterprise Synergy 480 Gen10 Compute Module | ssj_ops@100% = 5,924,100 ssj_ops@100% per JVM = 1,481,025 |
||||
| Test Sponsor: | Hewlett Packard Enterprise | SPEC License #: | 3 | Test Method: | Multi Node |
| Tested By: | Hewlett Packard Enterprise | Test Location: | Houston, TX, USA | Test Date: | Mar 12, 2019 |
| Hardware Availability: | Apr-2019 | Software Availability: | Mar-2019 | Publication: | Apr 2, 2019 |
| System Source: | Single Supplier | System Designation: | Server | Power Provisioning: | Line-powered |
| Target Load | Actual Load | ssj_ops | |
|---|---|---|---|
| Target | Actual | ||
| Calibration 1 | 5,953,811 | ||
| Calibration 2 | 5,943,390 | ||
| Calibration 3 | 5,940,537 | ||
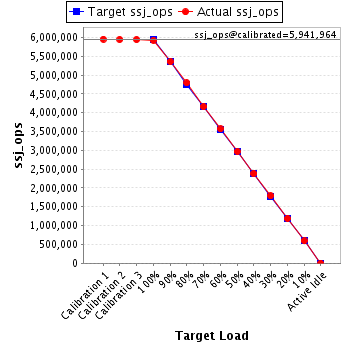
| ssj_ops@calibrated=5,941,964 | |||
| 100% | 99.7% | 5,941,964 | 5,924,100 |
| 90% | 90.1% | 5,347,767 | 5,355,777 |
| 80% | 80.7% | 4,753,571 | 4,792,890 |
| 70% | 70.0% | 4,159,375 | 4,161,923 |
| 60% | 60.0% | 3,565,178 | 3,567,452 |
| 50% | 49.9% | 2,970,982 | 2,967,673 |
| 40% | 40.0% | 2,376,786 | 2,379,488 |
| 30% | 30.1% | 1,782,589 | 1,787,901 |
| 20% | 20.0% | 1,188,393 | 1,190,540 |
| 10% | 10.0% | 594,196 | 595,075 |
| Active Idle | 0 | 0 | |
| Set Identifier: | SUT |
| Set Description: | System Under Test |
| # of Identical Nodes: | 10 |
| Comment: | SUT |
| Hardware | |
|---|---|
| Hardware Vendor: | Hewlett Packard Enterprise |
| Model: | Synergy 480 Gen10 Compute Module |
| Form Factor: | blade |
| CPU Name: | Intel Xeon Platinum 8280 @ 2.70GHz |
| CPU Characteristics: | 28-Core, 2.70 GHz, 38.5MB L3 Cache |
| CPU Frequency (MHz): | 2700 |
| CPU(s) Enabled: | 56 cores, 2 chips, 28 cores/chip |
| Hardware Threads: | 112 (2 / core) |
| CPU(s) Orderable: | 1,2 chips |
| Primary Cache: | 32 KB I + 32 KB D on chip per core |
| Secondary Cache: | 1 MB I+D on chip per core |
| Tertiary Cache: | 39424 KB I+D on chip per chip |
| Other Cache: | None |
| Memory Amount (GB): | 192 |
| # and size of DIMM: | 12 x 16384 MB |
| Memory Details: | 12 x 16GB 2Rx8 PC4-2933Y-R; slots 1, 3, 5, 8, 10 and 12 populated on each socket |
| Power Supply Quantity and Rating (W): | None |
| Power Supply Details: | N/A |
| Disk Drive: | 1 x HPE 480GB SATA 6G M.2 2280 (875498-B21) |
| Disk Controller: | HPE Smart Array S100i SR Gen10 |
| # and type of Network Interface Cards (NICs) Installed: | 1 x HPE Synergy 3820C 10/20Gb CNA |
| NICs Enabled in Firmware / OS / Connected: | 2/2/1 |
| Network Speed (Mbit): | 1000 |
| Keyboard: | None |
| Mouse: | None |
| Monitor: | None |
| Optical Drives: | No |
| Other Hardware: | None |
| Software | |
|---|---|
| Power Management: | Enabled (see SUT Notes) |
| Operating System (OS): | SUSE Linux Enterprise Server 12 SP4 |
| OS Version: | 4.12.14-94.41-default |
| Filesystem: | xfs |
| JVM Vendor: | Oracle Corporation |
| JVM Version: | Oracle Java HotSpot(TM) 64-Bit Server VM (build 24.80-b11, mixed mode), version 1.7.0_80 |
| JVM Command-line Options: | -server -Xmn19g -Xms21g -Xmx21g -XX:SurvivorRatio=1 -XX:TargetSurvivorRatio=99 -XX:AllocatePrefetchDistance=384 -XX:AllocatePrefetchLines=4 -XX:LoopUnrollLimit=37 -XX:InitialTenuringThreshold=12 -XX:MaxTenuringThreshold=15 -XX:ParallelGCThreads=28 -XX:InlineSmallCode=3900 -XX:MaxInlineSize=270 -XX:FreqInlineSize=2500 -XX:+AggressiveOpts -XX:+UseLargePages -XX:+UseParallelOldGC |
| JVM Affinity: | numactl --cpunodebind=[0-3] --localalloc |
| JVM Instances: | 4 |
| JVM Initial Heap (MB): | 21000 |
| JVM Maximum Heap (MB): | 21000 |
| JVM Address Bits: | 64 |
| Boot Firmware Version: | I42 v2.00 (02/02/2019) |
| Management Firmware Version: | 1.40 Feb 05 2019 |
| Workload Version: | SSJ 1.2.10 |
| Director Location: | Controller |
| Other Software: | HPE Service Pack for ProLiant (SPP) - Version 2019.03.0 (Mar 2019) |
| JVM Instance | ssj_ops@100% |
|---|---|
| SY480-05.001 | 1,487,456 |
| SY480-05.002 | 1,492,126 |
| SY480-05.003 | 1,468,724 |
| SY480-05.004 | 1,475,794 |
| ssj_ops@100% | 5,924,100 |
| ssj_ops@100% per JVM | 1,481,025 |

| Target Load | Actual Load | ssj_ops | |
|---|---|---|---|
| Target | Actual | ||
| Calibration 1 | 1,497,767 | ||
| Calibration 2 | 1,494,843 | ||
| Calibration 3 | 1,492,290 | ||
| ssj_ops@calibrated=1,493,566 | |||
| 100% | 99.6% | 1,493,566 | 1,487,456 |
| 90% | 90.2% | 1,344,210 | 1,346,606 |
| 80% | 79.9% | 1,194,853 | 1,192,932 |
| 70% | 70.0% | 1,045,496 | 1,045,320 |
| 60% | 59.9% | 896,140 | 895,231 |
| 50% | 49.9% | 746,783 | 745,227 |
| 40% | 40.2% | 597,427 | 599,974 |
| 30% | 30.0% | 448,070 | 448,785 |
| 20% | 20.1% | 298,713 | 299,547 |
| 10% | 10.1% | 149,357 | 150,510 |
| Active Idle | 0 | 0 | |

| Target Load | Actual Load | ssj_ops | |
|---|---|---|---|
| Target | Actual | ||
| Calibration 1 | 1,498,390 | ||
| Calibration 2 | 1,494,334 | ||
| Calibration 3 | 1,496,364 | ||
| ssj_ops@calibrated=1,495,349 | |||
| 100% | 99.8% | 1,495,349 | 1,492,126 |
| 90% | 90.1% | 1,345,814 | 1,347,310 |
| 80% | 82.5% | 1,196,279 | 1,233,278 |
| 70% | 70.1% | 1,046,744 | 1,048,820 |
| 60% | 59.9% | 897,209 | 896,279 |
| 50% | 49.9% | 747,674 | 746,816 |
| 40% | 40.1% | 598,140 | 599,388 |
| 30% | 30.2% | 448,605 | 451,221 |
| 20% | 20.0% | 299,070 | 299,088 |
| 10% | 10.0% | 149,535 | 149,258 |
| Active Idle | 0 | 0 | |

| Target Load | Actual Load | ssj_ops | |
|---|---|---|---|
| Target | Actual | ||
| Calibration 1 | 1,473,408 | ||
| Calibration 2 | 1,474,651 | ||
| Calibration 3 | 1,471,109 | ||
| ssj_ops@calibrated=1,472,880 | |||
| 100% | 99.7% | 1,472,880 | 1,468,724 |
| 90% | 90.1% | 1,325,592 | 1,327,300 |
| 80% | 80.1% | 1,178,304 | 1,179,548 |
| 70% | 70.0% | 1,031,016 | 1,031,576 |
| 60% | 60.1% | 883,728 | 885,010 |
| 50% | 49.9% | 736,440 | 734,500 |
| 40% | 39.8% | 589,152 | 586,520 |
| 30% | 30.0% | 441,864 | 442,109 |
| 20% | 20.0% | 294,576 | 295,193 |
| 10% | 10.0% | 147,288 | 147,732 |
| Active Idle | 0 | 0 | |

| Target Load | Actual Load | ssj_ops | |
|---|---|---|---|
| Target | Actual | ||
| Calibration 1 | 1,484,246 | ||
| Calibration 2 | 1,479,562 | ||
| Calibration 3 | 1,480,775 | ||
| ssj_ops@calibrated=1,480,169 | |||
| 100% | 99.7% | 1,480,169 | 1,475,794 |
| 90% | 90.2% | 1,332,152 | 1,334,561 |
| 80% | 80.2% | 1,184,135 | 1,187,131 |
| 70% | 70.0% | 1,036,118 | 1,036,208 |
| 60% | 60.2% | 888,101 | 890,932 |
| 50% | 50.1% | 740,084 | 741,131 |
| 40% | 40.1% | 592,067 | 593,606 |
| 30% | 30.1% | 444,051 | 445,787 |
| 20% | 20.0% | 296,034 | 296,713 |
| 10% | 10.0% | 148,017 | 147,576 |
| Active Idle | 0 | 0 | |
