SPECpower_ssj2008
Host 'SY480-04' Performance Report
Copyright © 2007-2019 Standard Performance Evaluation Corporation
| Hewlett Packard Enterprise Synergy 480 Gen10 Compute Module | ssj_ops@100% = 5,887,969 ssj_ops@100% per JVM = 1,471,992 |
||||
| Test Sponsor: | Hewlett Packard Enterprise | SPEC License #: | 3 | Test Method: | Multi Node |
| Tested By: | Hewlett Packard Enterprise | Test Location: | Houston, TX, USA | Test Date: | Mar 12, 2019 |
| Hardware Availability: | Apr-2019 | Software Availability: | Mar-2019 | Publication: | Apr 2, 2019 |
| System Source: | Single Supplier | System Designation: | Server | Power Provisioning: | Line-powered |
| Target Load | Actual Load | ssj_ops | |
|---|---|---|---|
| Target | Actual | ||
| Calibration 1 | 5,903,556 | ||
| Calibration 2 | 5,895,415 | ||
| Calibration 3 | 5,902,374 | ||
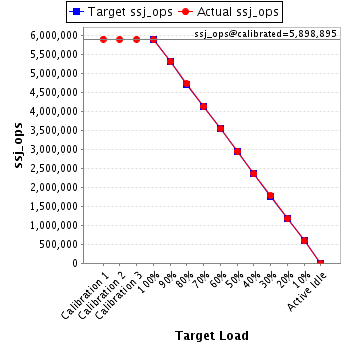
| ssj_ops@calibrated=5,898,895 | |||
| 100% | 99.8% | 5,898,895 | 5,887,969 |
| 90% | 90.0% | 5,309,005 | 5,306,714 |
| 80% | 80.2% | 4,719,116 | 4,728,316 |
| 70% | 70.0% | 4,129,226 | 4,128,276 |
| 60% | 60.0% | 3,539,337 | 3,539,136 |
| 50% | 49.9% | 2,949,447 | 2,943,622 |
| 40% | 39.9% | 2,359,558 | 2,354,030 |
| 30% | 30.1% | 1,769,668 | 1,773,745 |
| 20% | 20.0% | 1,179,779 | 1,177,160 |
| 10% | 10.0% | 589,889 | 588,440 |
| Active Idle | 0 | 0 | |
| Set Identifier: | SUT |
| Set Description: | System Under Test |
| # of Identical Nodes: | 8 |
| Comment: | SUT |
| Hardware | |
|---|---|
| Hardware Vendor: | Hewlett Packard Enterprise |
| Model: | Synergy 480 Gen10 Compute Module |
| Form Factor: | blade |
| CPU Name: | Intel Xeon Platinum 8280 @ 2.70GHz |
| CPU Characteristics: | 28-Core, 2.70 GHz, 38.5MB L3 Cache |
| CPU Frequency (MHz): | 2700 |
| CPU(s) Enabled: | 56 cores, 2 chips, 28 cores/chip |
| Hardware Threads: | 112 (2 / core) |
| CPU(s) Orderable: | 1,2 chips |
| Primary Cache: | 32 KB I + 32 KB D on chip per core |
| Secondary Cache: | 1 MB I+D on chip per core |
| Tertiary Cache: | 39424 KB I+D on chip per chip |
| Other Cache: | None |
| Memory Amount (GB): | 192 |
| # and size of DIMM: | 12 x 16384 MB |
| Memory Details: | 12 x 16GB 2Rx8 PC4-2933Y-R; slots 1, 3, 5, 8, 10 and 12 populated on each socket |
| Power Supply Quantity and Rating (W): | None |
| Power Supply Details: | N/A |
| Disk Drive: | 1 x HPE 480GB SATA 6G M.2 2280 (875498-B21) |
| Disk Controller: | HPE Smart Array S100i SR Gen10 |
| # and type of Network Interface Cards (NICs) Installed: | 1 x HPE Synergy 3820C 10/20Gb CNA |
| NICs Enabled in Firmware / OS / Connected: | 2/2/1 |
| Network Speed (Mbit): | 1000 |
| Keyboard: | None |
| Mouse: | None |
| Monitor: | None |
| Optical Drives: | No |
| Other Hardware: | None |
| Software | |
|---|---|
| Power Management: | Enabled (see SUT Notes) |
| Operating System (OS): | SUSE Linux Enterprise Server 12 SP4 |
| OS Version: | 4.12.14-94.41-default |
| Filesystem: | xfs |
| JVM Vendor: | Oracle Corporation |
| JVM Version: | Oracle Java HotSpot(TM) 64-Bit Server VM (build 24.80-b11, mixed mode), version 1.7.0_80 |
| JVM Command-line Options: | -server -Xmn19g -Xms21g -Xmx21g -XX:SurvivorRatio=1 -XX:TargetSurvivorRatio=99 -XX:AllocatePrefetchDistance=384 -XX:AllocatePrefetchLines=4 -XX:LoopUnrollLimit=37 -XX:InitialTenuringThreshold=12 -XX:MaxTenuringThreshold=15 -XX:ParallelGCThreads=28 -XX:InlineSmallCode=3900 -XX:MaxInlineSize=270 -XX:FreqInlineSize=2500 -XX:+AggressiveOpts -XX:+UseLargePages -XX:+UseParallelOldGC |
| JVM Affinity: | numactl --cpunodebind=[0-3] --localalloc |
| JVM Instances: | 4 |
| JVM Initial Heap (MB): | 21000 |
| JVM Maximum Heap (MB): | 21000 |
| JVM Address Bits: | 64 |
| Boot Firmware Version: | I42 v2.00 (02/02/2019) |
| Management Firmware Version: | 1.40 Feb 05 2019 |
| Workload Version: | SSJ 1.2.10 |
| Director Location: | Controller |
| Other Software: | HPE Service Pack for ProLiant (SPP) - Version 2019.03.0 (Mar 2019) |
| JVM Instance | ssj_ops@100% |
|---|---|
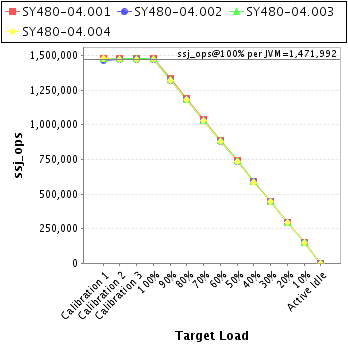
| SY480-04.001 | 1,476,014 |
| SY480-04.002 | 1,468,458 |
| SY480-04.003 | 1,475,140 |
| SY480-04.004 | 1,468,358 |
| ssj_ops@100% | 5,887,969 |
| ssj_ops@100% per JVM | 1,471,992 |
| Target Load | Actual Load | ssj_ops | |
|---|---|---|---|
| Target | Actual | ||
| Calibration 1 | 1,480,579 | ||
| Calibration 2 | 1,478,618 | ||
| Calibration 3 | 1,480,177 | ||
| ssj_ops@calibrated=1,479,397 | |||
| 100% | 99.8% | 1,479,397 | 1,476,014 |
| 90% | 90.1% | 1,331,458 | 1,332,504 |
| 80% | 80.2% | 1,183,518 | 1,186,659 |
| 70% | 70.0% | 1,035,578 | 1,035,148 |
| 60% | 60.1% | 887,638 | 888,390 |
| 50% | 49.9% | 739,699 | 738,572 |
| 40% | 39.8% | 591,759 | 589,185 |
| 30% | 30.0% | 443,819 | 443,863 |
| 20% | 20.0% | 295,879 | 296,349 |
| 10% | 10.0% | 147,940 | 148,110 |
| Active Idle | 0 | 0 | |

| Target Load | Actual Load | ssj_ops | |
|---|---|---|---|
| Target | Actual | ||
| Calibration 1 | 1,467,290 | ||
| Calibration 2 | 1,471,533 | ||
| Calibration 3 | 1,469,657 | ||
| ssj_ops@calibrated=1,470,595 | |||
| 100% | 99.9% | 1,470,595 | 1,468,458 |
| 90% | 89.9% | 1,323,535 | 1,322,492 |
| 80% | 80.2% | 1,176,476 | 1,179,072 |
| 70% | 70.1% | 1,029,416 | 1,031,277 |
| 60% | 59.9% | 882,357 | 881,362 |
| 50% | 49.8% | 735,297 | 732,999 |
| 40% | 40.0% | 588,238 | 588,710 |
| 30% | 30.1% | 441,178 | 442,772 |
| 20% | 20.0% | 294,119 | 293,479 |
| 10% | 10.0% | 147,059 | 147,281 |
| Active Idle | 0 | 0 | |

| Target Load | Actual Load | ssj_ops | |
|---|---|---|---|
| Target | Actual | ||
| Calibration 1 | 1,480,371 | ||
| Calibration 2 | 1,476,400 | ||
| Calibration 3 | 1,480,419 | ||
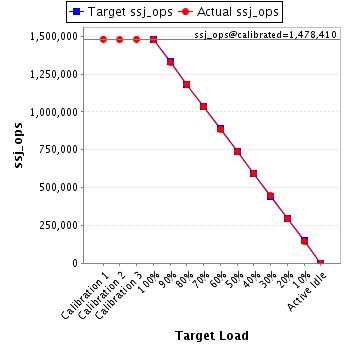
| ssj_ops@calibrated=1,478,410 | |||
| 100% | 99.8% | 1,478,410 | 1,475,140 |
| 90% | 89.9% | 1,330,569 | 1,329,226 |
| 80% | 80.0% | 1,182,728 | 1,183,292 |
| 70% | 69.9% | 1,034,887 | 1,033,214 |
| 60% | 60.0% | 887,046 | 886,775 |
| 50% | 49.9% | 739,205 | 738,313 |
| 40% | 40.0% | 591,364 | 590,983 |
| 30% | 30.1% | 443,523 | 444,469 |
| 20% | 19.9% | 295,682 | 294,538 |
| 10% | 9.9% | 147,841 | 146,352 |
| Active Idle | 0 | 0 | |
| Target Load | Actual Load | ssj_ops | |
|---|---|---|---|
| Target | Actual | ||
| Calibration 1 | 1,475,317 | ||
| Calibration 2 | 1,468,865 | ||
| Calibration 3 | 1,472,121 | ||
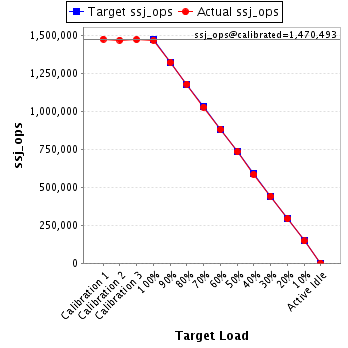
| ssj_ops@calibrated=1,470,493 | |||
| 100% | 99.9% | 1,470,493 | 1,468,358 |
| 90% | 89.9% | 1,323,444 | 1,322,491 |
| 80% | 80.2% | 1,176,394 | 1,179,294 |
| 70% | 70.0% | 1,029,345 | 1,028,636 |
| 60% | 60.0% | 882,296 | 882,608 |
| 50% | 49.9% | 735,246 | 733,738 |
| 40% | 39.8% | 588,197 | 585,152 |
| 30% | 30.1% | 441,148 | 442,642 |
| 20% | 19.9% | 294,099 | 292,794 |
| 10% | 10.0% | 147,049 | 146,697 |
| Active Idle | 0 | 0 | |