SPECpower_ssj2008
Host 'SY480-03' Performance Report
Copyright © 2007-2019 Standard Performance Evaluation Corporation
| Hewlett Packard Enterprise Synergy 480 Gen10 Compute Module | ssj_ops@100% = 5,896,368 ssj_ops@100% per JVM = 1,474,092 |
||||
| Test Sponsor: | Hewlett Packard Enterprise | SPEC License #: | 3 | Test Method: | Multi Node |
| Tested By: | Hewlett Packard Enterprise | Test Location: | Houston, TX, USA | Test Date: | Mar 12, 2019 |
| Hardware Availability: | Apr-2019 | Software Availability: | Mar-2019 | Publication: | Apr 2, 2019 |
| System Source: | Single Supplier | System Designation: | Server | Power Provisioning: | Line-powered |
| Target Load | Actual Load | ssj_ops | |
|---|---|---|---|
| Target | Actual | ||
| Calibration 1 | 5,935,279 | ||
| Calibration 2 | 5,928,649 | ||
| Calibration 3 | 5,913,581 | ||
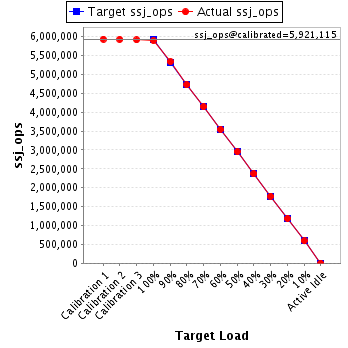
| ssj_ops@calibrated=5,921,115 | |||
| 100% | 99.6% | 5,921,115 | 5,896,368 |
| 90% | 90.2% | 5,329,003 | 5,339,790 |
| 80% | 79.9% | 4,736,892 | 4,729,415 |
| 70% | 70.0% | 4,144,780 | 4,144,234 |
| 60% | 59.9% | 3,552,669 | 3,549,331 |
| 50% | 49.9% | 2,960,557 | 2,953,706 |
| 40% | 40.0% | 2,368,446 | 2,368,123 |
| 30% | 30.0% | 1,776,334 | 1,777,807 |
| 20% | 20.0% | 1,184,223 | 1,184,084 |
| 10% | 10.0% | 592,111 | 593,177 |
| Active Idle | 0 | 0 | |
| Set Identifier: | SUT |
| Set Description: | System Under Test |
| # of Identical Nodes: | 5 |
| Comment: | SUT |
| Hardware | |
|---|---|
| Hardware Vendor: | Hewlett Packard Enterprise |
| Model: | Synergy 480 Gen10 Compute Module |
| Form Factor: | blade |
| CPU Name: | Intel Xeon Platinum 8280 @ 2.70GHz |
| CPU Characteristics: | 28-Core, 2.70 GHz, 38.5MB L3 Cache |
| CPU Frequency (MHz): | 2700 |
| CPU(s) Enabled: | 56 cores, 2 chips, 28 cores/chip |
| Hardware Threads: | 112 (2 / core) |
| CPU(s) Orderable: | 1,2 chips |
| Primary Cache: | 32 KB I + 32 KB D on chip per core |
| Secondary Cache: | 1 MB I+D on chip per core |
| Tertiary Cache: | 39424 KB I+D on chip per chip |
| Other Cache: | None |
| Memory Amount (GB): | 192 |
| # and size of DIMM: | 12 x 16384 MB |
| Memory Details: | 12 x 16GB 2Rx8 PC4-2933Y-R; slots 1, 3, 5, 8, 10 and 12 populated on each socket |
| Power Supply Quantity and Rating (W): | None |
| Power Supply Details: | N/A |
| Disk Drive: | 1 x HPE 480GB SATA 6G M.2 2280 (875498-B21) |
| Disk Controller: | HPE Smart Array S100i SR Gen10 |
| # and type of Network Interface Cards (NICs) Installed: | 1 x HPE Synergy 3820C 10/20Gb CNA |
| NICs Enabled in Firmware / OS / Connected: | 2/2/1 |
| Network Speed (Mbit): | 1000 |
| Keyboard: | None |
| Mouse: | None |
| Monitor: | None |
| Optical Drives: | No |
| Other Hardware: | None |
| Software | |
|---|---|
| Power Management: | Enabled (see SUT Notes) |
| Operating System (OS): | SUSE Linux Enterprise Server 12 SP4 |
| OS Version: | 4.12.14-94.41-default |
| Filesystem: | xfs |
| JVM Vendor: | Oracle Corporation |
| JVM Version: | Oracle Java HotSpot(TM) 64-Bit Server VM (build 24.80-b11, mixed mode), version 1.7.0_80 |
| JVM Command-line Options: | -server -Xmn19g -Xms21g -Xmx21g -XX:SurvivorRatio=1 -XX:TargetSurvivorRatio=99 -XX:AllocatePrefetchDistance=384 -XX:AllocatePrefetchLines=4 -XX:LoopUnrollLimit=37 -XX:InitialTenuringThreshold=12 -XX:MaxTenuringThreshold=15 -XX:ParallelGCThreads=28 -XX:InlineSmallCode=3900 -XX:MaxInlineSize=270 -XX:FreqInlineSize=2500 -XX:+AggressiveOpts -XX:+UseLargePages -XX:+UseParallelOldGC |
| JVM Affinity: | numactl --cpunodebind=[0-3] --localalloc |
| JVM Instances: | 4 |
| JVM Initial Heap (MB): | 21000 |
| JVM Maximum Heap (MB): | 21000 |
| JVM Address Bits: | 64 |
| Boot Firmware Version: | I42 v2.00 (02/02/2019) |
| Management Firmware Version: | 1.40 Feb 05 2019 |
| Workload Version: | SSJ 1.2.10 |
| Director Location: | Controller |
| Other Software: | HPE Service Pack for ProLiant (SPP) - Version 2019.03.0 (Mar 2019) |
| JVM Instance | ssj_ops@100% |
|---|---|
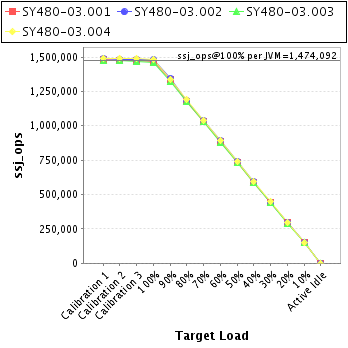
| SY480-03.001 | 1,469,558 |
| SY480-03.002 | 1,481,518 |
| SY480-03.003 | 1,462,650 |
| SY480-03.004 | 1,482,642 |
| ssj_ops@100% | 5,896,368 |
| ssj_ops@100% per JVM | 1,474,092 |
| Target Load | Actual Load | ssj_ops | |
|---|---|---|---|
| Target | Actual | ||
| Calibration 1 | 1,482,080 | ||
| Calibration 2 | 1,475,552 | ||
| Calibration 3 | 1,475,250 | ||
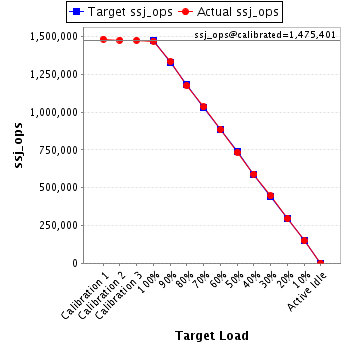
| ssj_ops@calibrated=1,475,401 | |||
| 100% | 99.6% | 1,475,401 | 1,469,558 |
| 90% | 90.4% | 1,327,861 | 1,333,434 |
| 80% | 79.6% | 1,180,321 | 1,175,139 |
| 70% | 70.1% | 1,032,781 | 1,033,605 |
| 60% | 59.9% | 885,241 | 883,262 |
| 50% | 49.8% | 737,701 | 734,558 |
| 40% | 40.0% | 590,160 | 590,045 |
| 30% | 30.2% | 442,620 | 444,859 |
| 20% | 20.1% | 295,080 | 296,494 |
| 10% | 10.1% | 147,540 | 148,903 |
| Active Idle | 0 | 0 | |
| Target Load | Actual Load | ssj_ops | |
|---|---|---|---|
| Target | Actual | ||
| Calibration 1 | 1,488,634 | ||
| Calibration 2 | 1,484,655 | ||
| Calibration 3 | 1,485,658 | ||
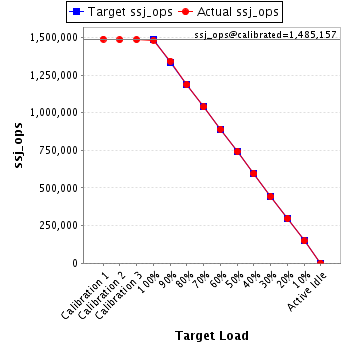
| ssj_ops@calibrated=1,485,157 | |||
| 100% | 99.8% | 1,485,157 | 1,481,518 |
| 90% | 90.4% | 1,336,641 | 1,342,890 |
| 80% | 79.9% | 1,188,125 | 1,186,581 |
| 70% | 69.9% | 1,039,610 | 1,038,348 |
| 60% | 60.0% | 891,094 | 891,418 |
| 50% | 50.0% | 742,578 | 742,711 |
| 40% | 40.0% | 594,063 | 594,460 |
| 30% | 29.9% | 445,547 | 443,384 |
| 20% | 20.0% | 297,031 | 297,311 |
| 10% | 10.0% | 148,516 | 148,371 |
| Active Idle | 0 | 0 | |
| Target Load | Actual Load | ssj_ops | |
|---|---|---|---|
| Target | Actual | ||
| Calibration 1 | 1,472,894 | ||
| Calibration 2 | 1,477,733 | ||
| Calibration 3 | 1,465,501 | ||
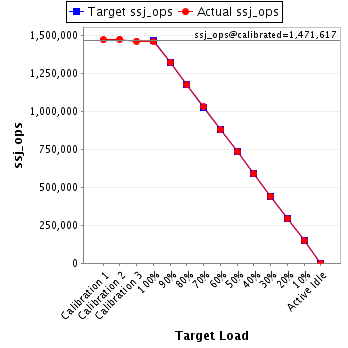
| ssj_ops@calibrated=1,471,617 | |||
| 100% | 99.4% | 1,471,617 | 1,462,650 |
| 90% | 90.1% | 1,324,456 | 1,325,472 |
| 80% | 79.9% | 1,177,294 | 1,175,819 |
| 70% | 70.0% | 1,030,132 | 1,030,598 |
| 60% | 59.9% | 882,970 | 881,333 |
| 50% | 50.0% | 735,809 | 735,200 |
| 40% | 40.1% | 588,647 | 589,487 |
| 30% | 30.0% | 441,485 | 442,034 |
| 20% | 19.9% | 294,323 | 292,801 |
| 10% | 10.0% | 147,162 | 147,853 |
| Active Idle | 0 | 0 | |
| Target Load | Actual Load | ssj_ops | |
|---|---|---|---|
| Target | Actual | ||
| Calibration 1 | 1,491,670 | ||
| Calibration 2 | 1,490,708 | ||
| Calibration 3 | 1,487,171 | ||
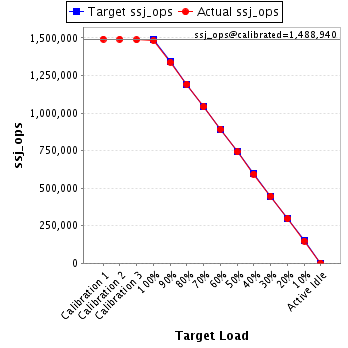
| ssj_ops@calibrated=1,488,940 | |||
| 100% | 99.6% | 1,488,940 | 1,482,642 |
| 90% | 89.9% | 1,340,046 | 1,337,994 |
| 80% | 80.0% | 1,191,152 | 1,191,876 |
| 70% | 70.0% | 1,042,258 | 1,041,682 |
| 60% | 60.0% | 893,364 | 893,318 |
| 50% | 49.8% | 744,470 | 741,236 |
| 40% | 39.9% | 595,576 | 594,131 |
| 30% | 30.1% | 446,682 | 447,530 |
| 20% | 20.0% | 297,788 | 297,478 |
| 10% | 9.9% | 148,894 | 148,050 |
| Active Idle | 0 | 0 | |