SPECpower_ssj2008
Host 'SY480-04' Performance Report
Copyright © 2007-2019 Standard Performance Evaluation Corporation
| Hewlett Packard Enterprise Synergy 480 Gen10 Compute Module | ssj_ops@100% = 5,920,263 ssj_ops@100% per JVM = 1,480,066 |
||||
| Test Sponsor: | Hewlett Packard Enterprise | SPEC License #: | 3 | Test Method: | Multi Node |
| Tested By: | Hewlett Packard Enterprise | Test Location: | Houston, TX, USA | Test Date: | Mar 12, 2019 |
| Hardware Availability: | Apr-2019 | Software Availability: | Mar-2019 | Publication: | Apr 2, 2019 |
| System Source: | Single Supplier | System Designation: | Server | Power Provisioning: | Line-powered |
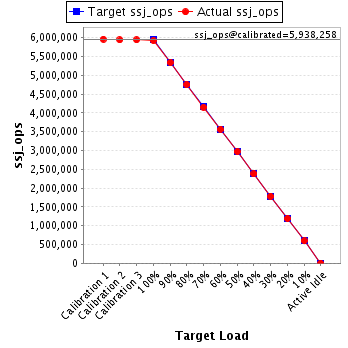
| Target Load | Actual Load | ssj_ops | |
|---|---|---|---|
| Target | Actual | ||
| Calibration 1 | 5,959,023 | ||
| Calibration 2 | 5,938,534 | ||
| Calibration 3 | 5,937,981 | ||
| ssj_ops@calibrated=5,938,258 | |||
| 100% | 99.7% | 5,938,258 | 5,920,263 |
| 90% | 89.9% | 5,344,432 | 5,338,905 |
| 80% | 80.0% | 4,750,606 | 4,749,369 |
| 70% | 69.9% | 4,156,780 | 4,152,416 |
| 60% | 60.0% | 3,562,955 | 3,565,617 |
| 50% | 50.0% | 2,969,129 | 2,967,550 |
| 40% | 40.0% | 2,375,303 | 2,374,764 |
| 30% | 30.0% | 1,781,477 | 1,780,713 |
| 20% | 20.0% | 1,187,652 | 1,187,116 |
| 10% | 10.0% | 593,826 | 594,757 |
| Active Idle | 0 | 0 | |
| Set Identifier: | SUT |
| Set Description: | System Under Test |
| # of Identical Nodes: | 5 |
| Comment: | SUT |
| Hardware | |
|---|---|
| Hardware Vendor: | Hewlett Packard Enterprise |
| Model: | Synergy 480 Gen10 Compute Module |
| Form Factor: | blade |
| CPU Name: | Intel Xeon Platinum 8280 @ 2.70GHz |
| CPU Characteristics: | 28-Core, 2.70 GHz, 38.5MB L3 Cache |
| CPU Frequency (MHz): | 2700 |
| CPU(s) Enabled: | 56 cores, 2 chips, 28 cores/chip |
| Hardware Threads: | 112 (2 / core) |
| CPU(s) Orderable: | 1,2 chips |
| Primary Cache: | 32 KB I + 32 KB D on chip per core |
| Secondary Cache: | 1 MB I+D on chip per core |
| Tertiary Cache: | 39424 KB I+D on chip per chip |
| Other Cache: | None |
| Memory Amount (GB): | 192 |
| # and size of DIMM: | 12 x 16384 MB |
| Memory Details: | 12 x 16GB 2Rx8 PC4-2933Y-R; slots 1, 3, 5, 8, 10 and 12 populated on each socket |
| Power Supply Quantity and Rating (W): | None |
| Power Supply Details: | N/A |
| Disk Drive: | 1 x HPE 480GB SATA 6G M.2 2280 (875498-B21) |
| Disk Controller: | HPE Smart Array S100i SR Gen10 |
| # and type of Network Interface Cards (NICs) Installed: | 1 x HPE Synergy 3820C 10/20Gb CNA |
| NICs Enabled in Firmware / OS / Connected: | 2/2/1 |
| Network Speed (Mbit): | 1000 |
| Keyboard: | None |
| Mouse: | None |
| Monitor: | None |
| Optical Drives: | No |
| Other Hardware: | None |
| Software | |
|---|---|
| Power Management: | Enabled (see SUT Notes) |
| Operating System (OS): | SUSE Linux Enterprise Server 12 SP4 |
| OS Version: | 4.12.14-94.41-default |
| Filesystem: | xfs |
| JVM Vendor: | Oracle Corporation |
| JVM Version: | Oracle Java HotSpot(TM) 64-Bit Server VM (build 24.80-b11, mixed mode), version 1.7.0_80 |
| JVM Command-line Options: | -server -Xmn19g -Xms21g -Xmx21g -XX:SurvivorRatio=1 -XX:TargetSurvivorRatio=99 -XX:AllocatePrefetchDistance=384 -XX:AllocatePrefetchLines=4 -XX:LoopUnrollLimit=37 -XX:InitialTenuringThreshold=12 -XX:MaxTenuringThreshold=15 -XX:ParallelGCThreads=28 -XX:InlineSmallCode=3900 -XX:MaxInlineSize=270 -XX:FreqInlineSize=2500 -XX:+AggressiveOpts -XX:+UseLargePages -XX:+UseParallelOldGC |
| JVM Affinity: | numactl --cpunodebind=[0-3] --localalloc |
| JVM Instances: | 4 |
| JVM Initial Heap (MB): | 21000 |
| JVM Maximum Heap (MB): | 21000 |
| JVM Address Bits: | 64 |
| Boot Firmware Version: | I42 v2.00 (02/02/2019) |
| Management Firmware Version: | 1.40 Feb 05 2019 |
| Workload Version: | SSJ 1.2.10 |
| Director Location: | Controller |
| Other Software: | HPE Service Pack for ProLiant (SPP) - Version 2019.03.0 (Mar 2019) |
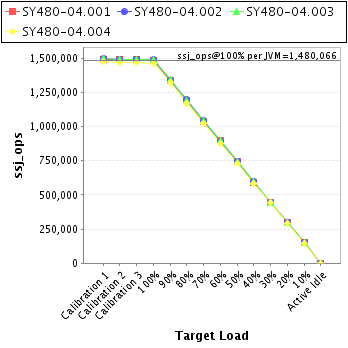
| JVM Instance | ssj_ops@100% |
|---|---|
| SY480-04.001 | 1,480,970 |
| SY480-04.002 | 1,486,880 |
| SY480-04.003 | 1,490,273 |
| SY480-04.004 | 1,462,140 |
| ssj_ops@100% | 5,920,263 |
| ssj_ops@100% per JVM | 1,480,066 |
| Target Load | Actual Load | ssj_ops | |
|---|---|---|---|
| Target | Actual | ||
| Calibration 1 | 1,492,111 | ||
| Calibration 2 | 1,490,195 | ||
| Calibration 3 | 1,486,967 | ||
| ssj_ops@calibrated=1,488,581 | |||
| 100% | 99.5% | 1,488,581 | 1,480,970 |
| 90% | 89.9% | 1,339,723 | 1,338,309 |
| 80% | 80.0% | 1,190,865 | 1,190,287 |
| 70% | 69.7% | 1,042,006 | 1,037,391 |
| 60% | 60.4% | 893,148 | 899,792 |
| 50% | 50.0% | 744,290 | 744,474 |
| 40% | 39.9% | 595,432 | 593,917 |
| 30% | 30.0% | 446,574 | 446,635 |
| 20% | 20.0% | 297,716 | 297,390 |
| 10% | 10.0% | 148,858 | 148,849 |
| Active Idle | 0 | 0 | |

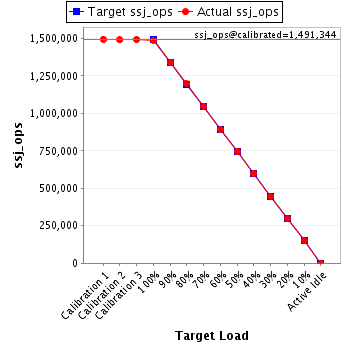
| Target Load | Actual Load | ssj_ops | |
|---|---|---|---|
| Target | Actual | ||
| Calibration 1 | 1,495,111 | ||
| Calibration 2 | 1,489,921 | ||
| Calibration 3 | 1,492,768 | ||
| ssj_ops@calibrated=1,491,344 | |||
| 100% | 99.7% | 1,491,344 | 1,486,880 |
| 90% | 89.8% | 1,342,210 | 1,339,019 |
| 80% | 80.2% | 1,193,075 | 1,196,638 |
| 70% | 70.1% | 1,043,941 | 1,045,128 |
| 60% | 59.8% | 894,807 | 891,805 |
| 50% | 50.1% | 745,672 | 747,287 |
| 40% | 40.2% | 596,538 | 599,260 |
| 30% | 29.9% | 447,403 | 445,362 |
| 20% | 20.0% | 298,269 | 298,748 |
| 10% | 10.1% | 149,134 | 149,935 |
| Active Idle | 0 | 0 | |
| Target Load | Actual Load | ssj_ops | |
|---|---|---|---|
| Target | Actual | ||
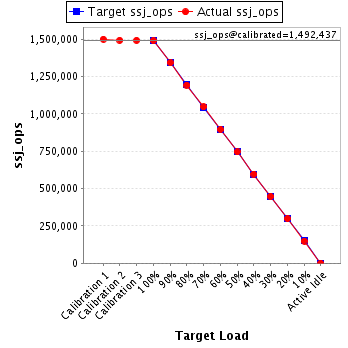
| Calibration 1 | 1,499,711 | ||
| Calibration 2 | 1,492,604 | ||
| Calibration 3 | 1,492,270 | ||
| ssj_ops@calibrated=1,492,437 | |||
| 100% | 99.9% | 1,492,437 | 1,490,273 |
| 90% | 90.0% | 1,343,193 | 1,342,908 |
| 80% | 79.9% | 1,193,950 | 1,192,976 |
| 70% | 70.1% | 1,044,706 | 1,046,476 |
| 60% | 60.1% | 895,462 | 896,996 |
| 50% | 49.9% | 746,219 | 744,973 |
| 40% | 40.0% | 596,975 | 597,324 |
| 30% | 30.0% | 447,731 | 447,613 |
| 20% | 20.0% | 298,487 | 298,086 |
| 10% | 10.0% | 149,244 | 148,966 |
| Active Idle | 0 | 0 | |
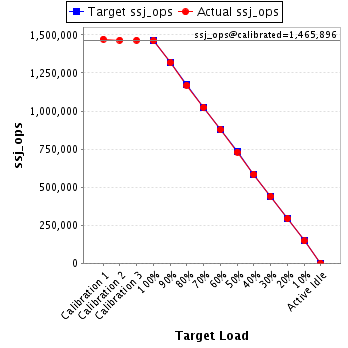
| Target Load | Actual Load | ssj_ops | |
|---|---|---|---|
| Target | Actual | ||
| Calibration 1 | 1,472,089 | ||
| Calibration 2 | 1,465,815 | ||
| Calibration 3 | 1,465,976 | ||
| ssj_ops@calibrated=1,465,896 | |||
| 100% | 99.7% | 1,465,896 | 1,462,140 |
| 90% | 90.0% | 1,319,306 | 1,318,668 |
| 80% | 79.8% | 1,172,716 | 1,169,468 |
| 70% | 69.8% | 1,026,127 | 1,023,421 |
| 60% | 59.8% | 879,537 | 877,024 |
| 50% | 49.9% | 732,948 | 730,816 |
| 40% | 39.9% | 586,358 | 584,263 |
| 30% | 30.1% | 439,769 | 441,103 |
| 20% | 20.0% | 293,179 | 292,892 |
| 10% | 10.0% | 146,590 | 147,008 |
| Active Idle | 0 | 0 | |