SPECpower_ssj2008
Host 'SY480-05' Performance Report
Copyright © 2007-2019 Standard Performance Evaluation Corporation
| Hewlett Packard Enterprise Synergy 480 Gen10 Compute Module | ssj_ops@100% = 5,933,541 ssj_ops@100% per JVM = 1,483,385 |
||||
| Test Sponsor: | Hewlett Packard Enterprise | SPEC License #: | 3 | Test Method: | Multi Node |
| Tested By: | Hewlett Packard Enterprise | Test Location: | Houston, TX, USA | Test Date: | Mar 12, 2019 |
| Hardware Availability: | Apr-2019 | Software Availability: | Mar-2019 | Publication: | Apr 2, 2019 |
| System Source: | Single Supplier | System Designation: | Server | Power Provisioning: | Line-powered |
| Target Load | Actual Load | ssj_ops | |
|---|---|---|---|
| Target | Actual | ||
| Calibration 1 | 5,972,244 | ||
| Calibration 2 | 5,949,596 | ||
| Calibration 3 | 5,954,865 | ||
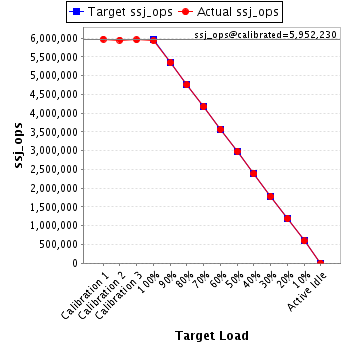
| ssj_ops@calibrated=5,952,230 | |||
| 100% | 99.7% | 5,952,230 | 5,933,541 |
| 90% | 89.9% | 5,357,007 | 5,349,484 |
| 80% | 79.9% | 4,761,784 | 4,752,875 |
| 70% | 70.1% | 4,166,561 | 4,169,579 |
| 60% | 60.0% | 3,571,338 | 3,572,637 |
| 50% | 50.1% | 2,976,115 | 2,981,231 |
| 40% | 40.0% | 2,380,892 | 2,382,101 |
| 30% | 29.9% | 1,785,669 | 1,782,291 |
| 20% | 20.0% | 1,190,446 | 1,190,668 |
| 10% | 10.0% | 595,223 | 594,353 |
| Active Idle | 0 | 0 | |
| Set Identifier: | SUT |
| Set Description: | System Under Test |
| # of Identical Nodes: | 5 |
| Comment: | SUT |
| Hardware | |
|---|---|
| Hardware Vendor: | Hewlett Packard Enterprise |
| Model: | Synergy 480 Gen10 Compute Module |
| Form Factor: | blade |
| CPU Name: | Intel Xeon Platinum 8280 @ 2.70GHz |
| CPU Characteristics: | 28-Core, 2.70 GHz, 38.5MB L3 Cache |
| CPU Frequency (MHz): | 2700 |
| CPU(s) Enabled: | 56 cores, 2 chips, 28 cores/chip |
| Hardware Threads: | 112 (2 / core) |
| CPU(s) Orderable: | 1,2 chips |
| Primary Cache: | 32 KB I + 32 KB D on chip per core |
| Secondary Cache: | 1 MB I+D on chip per core |
| Tertiary Cache: | 39424 KB I+D on chip per chip |
| Other Cache: | None |
| Memory Amount (GB): | 192 |
| # and size of DIMM: | 12 x 16384 MB |
| Memory Details: | 12 x 16GB 2Rx8 PC4-2933Y-R; slots 1, 3, 5, 8, 10 and 12 populated on each socket |
| Power Supply Quantity and Rating (W): | None |
| Power Supply Details: | N/A |
| Disk Drive: | 1 x HPE 480GB SATA 6G M.2 2280 (875498-B21) |
| Disk Controller: | HPE Smart Array S100i SR Gen10 |
| # and type of Network Interface Cards (NICs) Installed: | 1 x HPE Synergy 3820C 10/20Gb CNA |
| NICs Enabled in Firmware / OS / Connected: | 2/2/1 |
| Network Speed (Mbit): | 1000 |
| Keyboard: | None |
| Mouse: | None |
| Monitor: | None |
| Optical Drives: | No |
| Other Hardware: | None |
| Software | |
|---|---|
| Power Management: | Enabled (see SUT Notes) |
| Operating System (OS): | SUSE Linux Enterprise Server 12 SP4 |
| OS Version: | 4.12.14-94.41-default |
| Filesystem: | xfs |
| JVM Vendor: | Oracle Corporation |
| JVM Version: | Oracle Java HotSpot(TM) 64-Bit Server VM (build 24.80-b11, mixed mode), version 1.7.0_80 |
| JVM Command-line Options: | -server -Xmn19g -Xms21g -Xmx21g -XX:SurvivorRatio=1 -XX:TargetSurvivorRatio=99 -XX:AllocatePrefetchDistance=384 -XX:AllocatePrefetchLines=4 -XX:LoopUnrollLimit=37 -XX:InitialTenuringThreshold=12 -XX:MaxTenuringThreshold=15 -XX:ParallelGCThreads=28 -XX:InlineSmallCode=3900 -XX:MaxInlineSize=270 -XX:FreqInlineSize=2500 -XX:+AggressiveOpts -XX:+UseLargePages -XX:+UseParallelOldGC |
| JVM Affinity: | numactl --cpunodebind=[0-3] --localalloc |
| JVM Instances: | 4 |
| JVM Initial Heap (MB): | 21000 |
| JVM Maximum Heap (MB): | 21000 |
| JVM Address Bits: | 64 |
| Boot Firmware Version: | I42 v2.00 (02/02/2019) |
| Management Firmware Version: | 1.40 Feb 05 2019 |
| Workload Version: | SSJ 1.2.10 |
| Director Location: | Controller |
| Other Software: | HPE Service Pack for ProLiant (SPP) - Version 2019.03.0 (Mar 2019) |
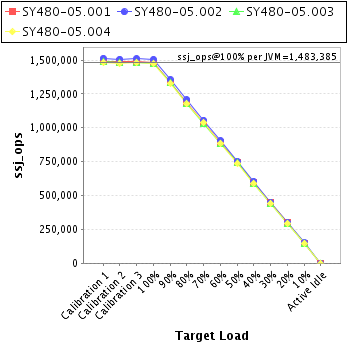
| JVM Instance | ssj_ops@100% |
|---|---|
| SY480-05.001 | 1,481,730 |
| SY480-05.002 | 1,505,861 |
| SY480-05.003 | 1,473,528 |
| SY480-05.004 | 1,472,422 |
| ssj_ops@100% | 5,933,541 |
| ssj_ops@100% per JVM | 1,483,385 |
| Target Load | Actual Load | ssj_ops | |
|---|---|---|---|
| Target | Actual | ||
| Calibration 1 | 1,489,002 | ||
| Calibration 2 | 1,486,301 | ||
| Calibration 3 | 1,487,404 | ||
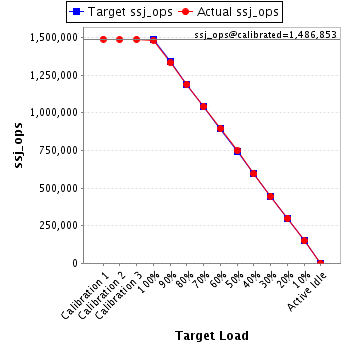
| ssj_ops@calibrated=1,486,853 | |||
| 100% | 99.7% | 1,486,853 | 1,481,730 |
| 90% | 89.7% | 1,338,167 | 1,333,540 |
| 80% | 80.0% | 1,189,482 | 1,188,949 |
| 70% | 70.1% | 1,040,797 | 1,041,590 |
| 60% | 60.2% | 892,112 | 894,877 |
| 50% | 50.2% | 743,426 | 746,935 |
| 40% | 40.0% | 594,741 | 594,294 |
| 30% | 30.0% | 446,056 | 445,657 |
| 20% | 20.1% | 297,371 | 298,763 |
| 10% | 10.0% | 148,685 | 148,785 |
| Active Idle | 0 | 0 | |
| Target Load | Actual Load | ssj_ops | |
|---|---|---|---|
| Target | Actual | ||
| Calibration 1 | 1,513,732 | ||
| Calibration 2 | 1,507,122 | ||
| Calibration 3 | 1,510,066 | ||
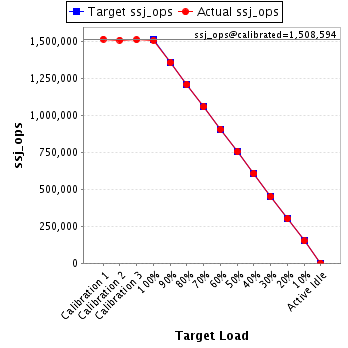
| ssj_ops@calibrated=1,508,594 | |||
| 100% | 99.8% | 1,508,594 | 1,505,861 |
| 90% | 89.9% | 1,357,735 | 1,356,520 |
| 80% | 80.0% | 1,206,875 | 1,207,354 |
| 70% | 70.1% | 1,056,016 | 1,056,785 |
| 60% | 60.1% | 905,156 | 906,140 |
| 50% | 50.0% | 754,297 | 753,789 |
| 40% | 40.1% | 603,438 | 605,440 |
| 30% | 29.9% | 452,578 | 450,772 |
| 20% | 19.9% | 301,719 | 300,411 |
| 10% | 10.0% | 150,859 | 151,121 |
| Active Idle | 0 | 0 | |
| Target Load | Actual Load | ssj_ops | |
|---|---|---|---|
| Target | Actual | ||
| Calibration 1 | 1,486,337 | ||
| Calibration 2 | 1,478,529 | ||
| Calibration 3 | 1,478,401 | ||
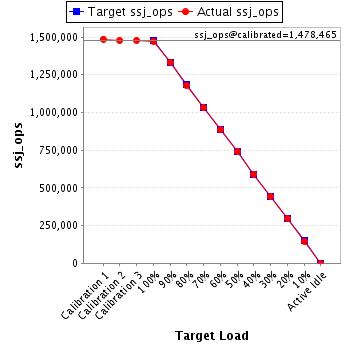
| ssj_ops@calibrated=1,478,465 | |||
| 100% | 99.7% | 1,478,465 | 1,473,528 |
| 90% | 90.1% | 1,330,619 | 1,331,434 |
| 80% | 79.9% | 1,182,772 | 1,180,800 |
| 70% | 69.9% | 1,034,926 | 1,033,103 |
| 60% | 59.8% | 887,079 | 884,311 |
| 50% | 50.1% | 739,233 | 741,193 |
| 40% | 40.0% | 591,386 | 591,071 |
| 30% | 30.0% | 443,540 | 443,225 |
| 20% | 19.9% | 295,693 | 294,427 |
| 10% | 9.9% | 147,847 | 146,730 |
| Active Idle | 0 | 0 | |
| Target Load | Actual Load | ssj_ops | |
|---|---|---|---|
| Target | Actual | ||
| Calibration 1 | 1,483,173 | ||
| Calibration 2 | 1,477,643 | ||
| Calibration 3 | 1,478,994 | ||
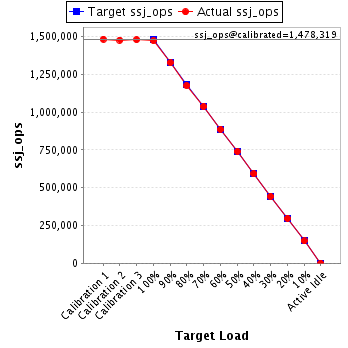
| ssj_ops@calibrated=1,478,319 | |||
| 100% | 99.6% | 1,478,319 | 1,472,422 |
| 90% | 89.8% | 1,330,487 | 1,327,989 |
| 80% | 79.5% | 1,182,655 | 1,175,773 |
| 70% | 70.2% | 1,034,823 | 1,038,101 |
| 60% | 60.0% | 886,991 | 887,310 |
| 50% | 50.0% | 739,159 | 739,314 |
| 40% | 40.0% | 591,327 | 591,296 |
| 30% | 29.9% | 443,496 | 442,637 |
| 20% | 20.1% | 295,664 | 297,067 |
| 10% | 10.0% | 147,832 | 147,717 |
| Active Idle | 0 | 0 | |