SPECpower_ssj2008
Host 'NODE07' Performance Report
Copyright © 2007-2019 Standard Performance Evaluation Corporation
| Hewlett Packard Enterprise Synergy 480 Gen10 Compute Module | ssj_ops@100% = 5,734,479 ssj_ops@100% per JVM = 1,433,620 |
||||
| Test Sponsor: | Hewlett Packard Enterprise | SPEC License #: | 3 | Test Method: | Multi Node |
| Tested By: | Hewlett Packard Enterprise | Test Location: | Houston, TX, USA | Test Date: | Mar 26, 2019 |
| Hardware Availability: | Apr-2019 | Software Availability: | Mar-2019 | Publication: | May 8, 2019 |
| System Source: | Single Supplier | System Designation: | Server | Power Provisioning: | Line-powered |
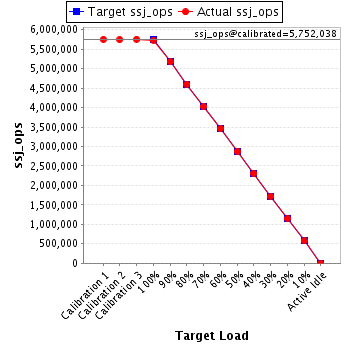
| Target Load | Actual Load | ssj_ops | |
|---|---|---|---|
| Target | Actual | ||
| Calibration 1 | 5,751,297 | ||
| Calibration 2 | 5,745,961 | ||
| Calibration 3 | 5,758,114 | ||
| ssj_ops@calibrated=5,752,038 | |||
| 100% | 99.7% | 5,752,038 | 5,734,479 |
| 90% | 90.0% | 5,176,834 | 5,174,652 |
| 80% | 80.1% | 4,601,630 | 4,604,668 |
| 70% | 70.0% | 4,026,426 | 4,026,902 |
| 60% | 60.0% | 3,451,223 | 3,453,209 |
| 50% | 49.9% | 2,876,019 | 2,871,242 |
| 40% | 40.0% | 2,300,815 | 2,301,931 |
| 30% | 30.0% | 1,725,611 | 1,724,743 |
| 20% | 20.0% | 1,150,408 | 1,149,752 |
| 10% | 10.0% | 575,204 | 575,899 |
| Active Idle | 0 | 0 | |
| Set Identifier: | SUT |
| Set Description: | System Under Test |
| # of Identical Nodes: | 9 |
| Comment: | SUT |
| Hardware | |
|---|---|
| Hardware Vendor: | Hewlett Packard Enterprise |
| Model: | Synergy 480 Gen10 Compute Module |
| Form Factor: | 7U |
| CPU Name: | Intel Xeon Platinum 8280 @ 2.70GHz (Intel Turbo Boost Technology up to 4.00 GHz) |
| CPU Characteristics: | 28-Core, 2.70 GHz, 38.5MB L3 Cache |
| CPU Frequency (MHz): | 2700 |
| CPU(s) Enabled: | 56 cores, 2 chips, 28 cores/chip |
| Hardware Threads: | 112 (2 / core) |
| CPU(s) Orderable: | 1,2 chips |
| Primary Cache: | 32 KB I + 32 KB D on chip per core |
| Secondary Cache: | 1 MB I+D on chip per core |
| Tertiary Cache: | 39424 KB I+D on chip per chip |
| Other Cache: | None |
| Memory Amount (GB): | 192 |
| # and size of DIMM: | 12 x 16384 MB |
| Memory Details: | 12 x 16GB 2Rx8 PC4-2933Y-R; slots 1, 3, 5, 8, 10 and 12 populated in each socket |
| Power Supply Quantity and Rating (W): | None |
| Power Supply Details: | N/A |
| Disk Drive: | 1 x HPE 240GB 6G SATA M.2 SSD (875488-B21) |
| Disk Controller: | HPE Smart Array S100i SR Gen10 |
| # and type of Network Interface Cards (NICs) Installed: | 1 x HPE Synergy 3820C 10/20Gb CNA |
| NICs Enabled in Firmware / OS / Connected: | 2/2/1 |
| Network Speed (Mbit): | 1000 |
| Keyboard: | None |
| Mouse: | None |
| Monitor: | None |
| Optical Drives: | No |
| Other Hardware: | H/S: Standard |
| Software | |
|---|---|
| Power Management: | Enabled (see SUT Notes) |
| Operating System (OS): | Windows Server 2012 R2 Datacenter |
| OS Version: | Version 6.3 (Build 9600) |
| Filesystem: | NTFS |
| JVM Vendor: | Oracle Corporation |
| JVM Version: | Oracle Java HotSpot(TM) 64-Bit Server VM (build 24.80-b11, mixed mode), version 1.7.0_80 |
| JVM Command-line Options: | -server -Xmn21000m -Xms24000m -Xmx24000m -XX:SurvivorRatio=1 -XX:TargetSurvivorRatio=99 -XX:AllocatePrefetchDistance=256 -XX:AllocatePrefetchLines=4 -XX:LoopUnrollLimit=45 -XX:InitialTenuringThreshold=12 -XX:MaxTenuringThreshold=15 -XX:ParallelGCThreads=28 -XX:InlineSmallCode=3900 -XX:MaxInlineSize=270 -XX:FreqInlineSize=2500 -XX:+AggressiveOpts -XX:+UseLargePages -XX:+UseParallelOldGC |
| JVM Affinity: | start /NODE [0,1,2,3] /AFFINITY [0xFFFFFFF] |
| JVM Instances: | 4 |
| JVM Initial Heap (MB): | 24000 |
| JVM Maximum Heap (MB): | 24000 |
| JVM Address Bits: | 64 |
| Boot Firmware Version: | I42 v2.00 (02/02/2019) |
| Management Firmware Version: | 1.40 Feb 05 2019 |
| Workload Version: | SSJ 1.2.10 |
| Director Location: | Controller |
| Other Software: | HPE Service Pack for ProLiant (SPP) Version: 2019.03.0, Microsoft Windows KB4056898, KB4338815 |
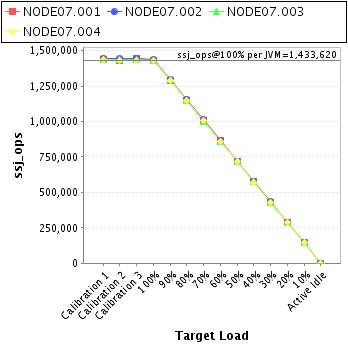
| JVM Instance | ssj_ops@100% |
|---|---|
| NODE07.001 | 1,433,417 |
| NODE07.002 | 1,439,575 |
| NODE07.003 | 1,432,562 |
| NODE07.004 | 1,428,926 |
| ssj_ops@100% | 5,734,479 |
| ssj_ops@100% per JVM | 1,433,620 |
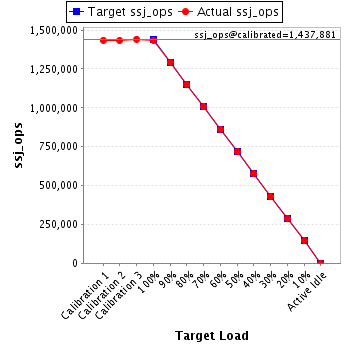
| Target Load | Actual Load | ssj_ops | |
|---|---|---|---|
| Target | Actual | ||
| Calibration 1 | 1,435,149 | ||
| Calibration 2 | 1,434,021 | ||
| Calibration 3 | 1,441,742 | ||
| ssj_ops@calibrated=1,437,881 | |||
| 100% | 99.7% | 1,437,881 | 1,433,417 |
| 90% | 89.9% | 1,294,093 | 1,292,720 |
| 80% | 80.0% | 1,150,305 | 1,150,985 |
| 70% | 69.9% | 1,006,517 | 1,005,739 |
| 60% | 60.0% | 862,729 | 863,192 |
| 50% | 49.9% | 718,941 | 717,038 |
| 40% | 40.0% | 575,153 | 575,775 |
| 30% | 29.9% | 431,364 | 430,483 |
| 20% | 19.9% | 287,576 | 286,197 |
| 10% | 10.0% | 143,788 | 144,030 |
| Active Idle | 0 | 0 | |
| Target Load | Actual Load | ssj_ops | |
|---|---|---|---|
| Target | Actual | ||
| Calibration 1 | 1,447,061 | ||
| Calibration 2 | 1,443,862 | ||
| Calibration 3 | 1,445,608 | ||
| ssj_ops@calibrated=1,444,735 | |||
| 100% | 99.6% | 1,444,735 | 1,439,575 |
| 90% | 89.8% | 1,300,262 | 1,297,689 |
| 80% | 80.2% | 1,155,788 | 1,158,356 |
| 70% | 70.1% | 1,011,315 | 1,012,349 |
| 60% | 60.0% | 866,841 | 866,815 |
| 50% | 49.9% | 722,368 | 720,546 |
| 40% | 40.0% | 577,894 | 577,719 |
| 30% | 29.9% | 433,421 | 432,535 |
| 20% | 20.0% | 288,947 | 288,525 |
| 10% | 10.0% | 144,474 | 144,007 |
| Active Idle | 0 | 0 | |

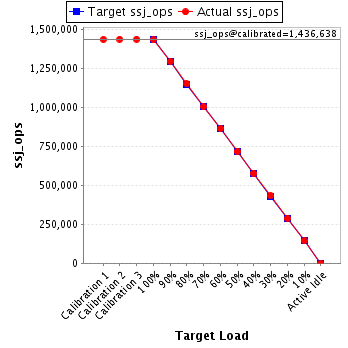
| Target Load | Actual Load | ssj_ops | |
|---|---|---|---|
| Target | Actual | ||
| Calibration 1 | 1,434,818 | ||
| Calibration 2 | 1,436,268 | ||
| Calibration 3 | 1,437,008 | ||
| ssj_ops@calibrated=1,436,638 | |||
| 100% | 99.7% | 1,436,638 | 1,432,562 |
| 90% | 90.2% | 1,292,974 | 1,295,323 |
| 80% | 80.1% | 1,149,310 | 1,150,141 |
| 70% | 69.8% | 1,005,647 | 1,003,419 |
| 60% | 60.0% | 861,983 | 862,603 |
| 50% | 49.9% | 718,319 | 716,903 |
| 40% | 40.1% | 574,655 | 575,941 |
| 30% | 30.1% | 430,991 | 431,731 |
| 20% | 20.0% | 287,328 | 287,576 |
| 10% | 10.0% | 143,664 | 143,276 |
| Active Idle | 0 | 0 | |
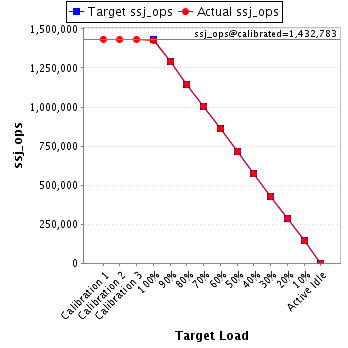
| Target Load | Actual Load | ssj_ops | |
|---|---|---|---|
| Target | Actual | ||
| Calibration 1 | 1,434,269 | ||
| Calibration 2 | 1,431,810 | ||
| Calibration 3 | 1,433,756 | ||
| ssj_ops@calibrated=1,432,783 | |||
| 100% | 99.7% | 1,432,783 | 1,428,926 |
| 90% | 90.0% | 1,289,505 | 1,288,920 |
| 80% | 79.9% | 1,146,227 | 1,145,186 |
| 70% | 70.2% | 1,002,948 | 1,005,395 |
| 60% | 60.1% | 859,670 | 860,599 |
| 50% | 50.0% | 716,392 | 716,756 |
| 40% | 40.0% | 573,113 | 572,496 |
| 30% | 30.0% | 429,835 | 429,994 |
| 20% | 20.1% | 286,557 | 287,454 |
| 10% | 10.1% | 143,278 | 144,587 |
| Active Idle | 0 | 0 | |