SPECpower_ssj2008
Host 'NODE05' Performance Report
Copyright © 2007-2019 Standard Performance Evaluation Corporation
| Hewlett Packard Enterprise Synergy 480 Gen10 Compute Module | ssj_ops@100% = 5,749,256 ssj_ops@100% per JVM = 1,437,314 |
||||
| Test Sponsor: | Hewlett Packard Enterprise | SPEC License #: | 3 | Test Method: | Multi Node |
| Tested By: | Hewlett Packard Enterprise | Test Location: | Houston, TX, USA | Test Date: | Mar 26, 2019 |
| Hardware Availability: | Apr-2019 | Software Availability: | Mar-2019 | Publication: | May 8, 2019 |
| System Source: | Single Supplier | System Designation: | Server | Power Provisioning: | Line-powered |
| Target Load | Actual Load | ssj_ops | |
|---|---|---|---|
| Target | Actual | ||
| Calibration 1 | 5,772,627 | ||
| Calibration 2 | 5,754,767 | ||
| Calibration 3 | 5,768,036 | ||
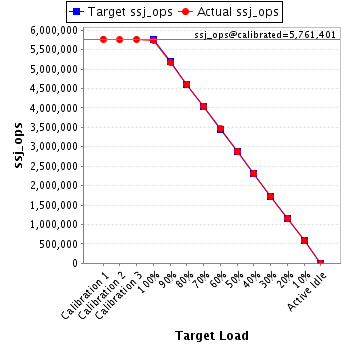
| ssj_ops@calibrated=5,761,401 | |||
| 100% | 99.8% | 5,761,401 | 5,749,256 |
| 90% | 89.9% | 5,185,261 | 5,181,791 |
| 80% | 80.0% | 4,609,121 | 4,610,218 |
| 70% | 70.0% | 4,032,981 | 4,033,201 |
| 60% | 60.1% | 3,456,841 | 3,461,552 |
| 50% | 50.0% | 2,880,701 | 2,882,167 |
| 40% | 40.1% | 2,304,561 | 2,310,021 |
| 30% | 30.0% | 1,728,420 | 1,727,698 |
| 20% | 20.0% | 1,152,280 | 1,153,508 |
| 10% | 10.1% | 576,140 | 579,314 |
| Active Idle | 0 | 0 | |
| Set Identifier: | SUT |
| Set Description: | System Under Test |
| # of Identical Nodes: | 8 |
| Comment: | SUT |
| Hardware | |
|---|---|
| Hardware Vendor: | Hewlett Packard Enterprise |
| Model: | Synergy 480 Gen10 Compute Module |
| Form Factor: | 7U |
| CPU Name: | Intel Xeon Platinum 8280 @ 2.70GHz (Intel Turbo Boost Technology up to 4.00 GHz) |
| CPU Characteristics: | 28-Core, 2.70 GHz, 38.5MB L3 Cache |
| CPU Frequency (MHz): | 2700 |
| CPU(s) Enabled: | 56 cores, 2 chips, 28 cores/chip |
| Hardware Threads: | 112 (2 / core) |
| CPU(s) Orderable: | 1,2 chips |
| Primary Cache: | 32 KB I + 32 KB D on chip per core |
| Secondary Cache: | 1 MB I+D on chip per core |
| Tertiary Cache: | 39424 KB I+D on chip per chip |
| Other Cache: | None |
| Memory Amount (GB): | 192 |
| # and size of DIMM: | 12 x 16384 MB |
| Memory Details: | 12 x 16GB 2Rx8 PC4-2933Y-R; slots 1, 3, 5, 8, 10 and 12 populated in each socket |
| Power Supply Quantity and Rating (W): | None |
| Power Supply Details: | N/A |
| Disk Drive: | 1 x HPE 240GB 6G SATA M.2 SSD (875488-B21) |
| Disk Controller: | HPE Smart Array S100i SR Gen10 |
| # and type of Network Interface Cards (NICs) Installed: | 1 x HPE Synergy 3820C 10/20Gb CNA |
| NICs Enabled in Firmware / OS / Connected: | 2/2/1 |
| Network Speed (Mbit): | 1000 |
| Keyboard: | None |
| Mouse: | None |
| Monitor: | None |
| Optical Drives: | No |
| Other Hardware: | H/S: Standard |
| Software | |
|---|---|
| Power Management: | Enabled (see SUT Notes) |
| Operating System (OS): | Windows Server 2012 R2 Datacenter |
| OS Version: | Version 6.3 (Build 9600) |
| Filesystem: | NTFS |
| JVM Vendor: | Oracle Corporation |
| JVM Version: | Oracle Java HotSpot(TM) 64-Bit Server VM (build 24.80-b11, mixed mode), version 1.7.0_80 |
| JVM Command-line Options: | -server -Xmn21000m -Xms24000m -Xmx24000m -XX:SurvivorRatio=1 -XX:TargetSurvivorRatio=99 -XX:AllocatePrefetchDistance=256 -XX:AllocatePrefetchLines=4 -XX:LoopUnrollLimit=45 -XX:InitialTenuringThreshold=12 -XX:MaxTenuringThreshold=15 -XX:ParallelGCThreads=28 -XX:InlineSmallCode=3900 -XX:MaxInlineSize=270 -XX:FreqInlineSize=2500 -XX:+AggressiveOpts -XX:+UseLargePages -XX:+UseParallelOldGC |
| JVM Affinity: | start /NODE [0,1,2,3] /AFFINITY [0xFFFFFFF] |
| JVM Instances: | 4 |
| JVM Initial Heap (MB): | 24000 |
| JVM Maximum Heap (MB): | 24000 |
| JVM Address Bits: | 64 |
| Boot Firmware Version: | I42 v2.00 (02/02/2019) |
| Management Firmware Version: | 1.40 Feb 05 2019 |
| Workload Version: | SSJ 1.2.10 |
| Director Location: | Controller |
| Other Software: | HPE Service Pack for ProLiant (SPP) Version: 2019.03.0, Microsoft Windows KB4056898, KB4338815 |
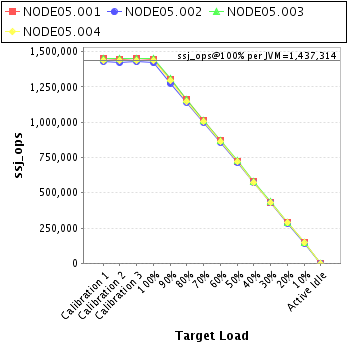
| JVM Instance | ssj_ops@100% |
|---|---|
| NODE05.001 | 1,442,945 |
| NODE05.002 | 1,420,863 |
| NODE05.003 | 1,450,910 |
| NODE05.004 | 1,434,538 |
| ssj_ops@100% | 5,749,256 |
| ssj_ops@100% per JVM | 1,437,314 |
| Target Load | Actual Load | ssj_ops | |
|---|---|---|---|
| Target | Actual | ||
| Calibration 1 | 1,449,048 | ||
| Calibration 2 | 1,444,433 | ||
| Calibration 3 | 1,449,485 | ||
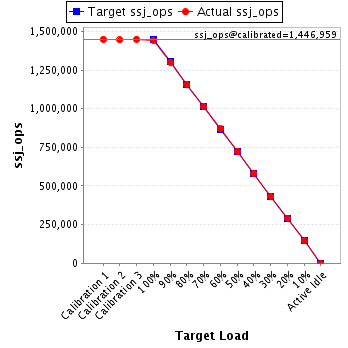
| ssj_ops@calibrated=1,446,959 | |||
| 100% | 99.7% | 1,446,959 | 1,442,945 |
| 90% | 90.0% | 1,302,263 | 1,301,703 |
| 80% | 80.1% | 1,157,567 | 1,158,542 |
| 70% | 70.0% | 1,012,871 | 1,013,047 |
| 60% | 60.2% | 868,175 | 870,409 |
| 50% | 49.9% | 723,479 | 721,700 |
| 40% | 40.2% | 578,784 | 581,448 |
| 30% | 30.0% | 434,088 | 433,978 |
| 20% | 20.2% | 289,392 | 291,682 |
| 10% | 10.0% | 144,696 | 145,256 |
| Active Idle | 0 | 0 | |
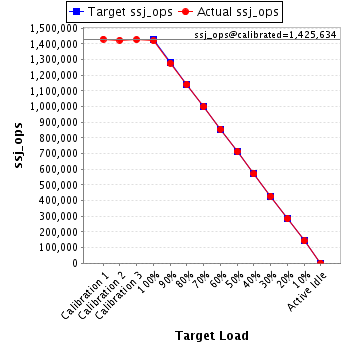
| Target Load | Actual Load | ssj_ops | |
|---|---|---|---|
| Target | Actual | ||
| Calibration 1 | 1,430,632 | ||
| Calibration 2 | 1,423,819 | ||
| Calibration 3 | 1,427,450 | ||
| ssj_ops@calibrated=1,425,634 | |||
| 100% | 99.7% | 1,425,634 | 1,420,863 |
| 90% | 89.6% | 1,283,071 | 1,276,783 |
| 80% | 80.1% | 1,140,507 | 1,141,293 |
| 70% | 70.1% | 997,944 | 998,871 |
| 60% | 60.1% | 855,381 | 856,646 |
| 50% | 50.1% | 712,817 | 713,590 |
| 40% | 40.0% | 570,254 | 570,248 |
| 30% | 30.1% | 427,690 | 428,477 |
| 20% | 19.9% | 285,127 | 284,357 |
| 10% | 10.0% | 142,563 | 142,534 |
| Active Idle | 0 | 0 | |
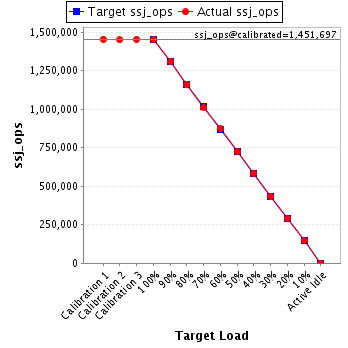
| Target Load | Actual Load | ssj_ops | |
|---|---|---|---|
| Target | Actual | ||
| Calibration 1 | 1,454,038 | ||
| Calibration 2 | 1,449,844 | ||
| Calibration 3 | 1,453,551 | ||
| ssj_ops@calibrated=1,451,697 | |||
| 100% | 99.9% | 1,451,697 | 1,450,910 |
| 90% | 90.1% | 1,306,528 | 1,308,047 |
| 80% | 80.0% | 1,161,358 | 1,161,158 |
| 70% | 69.8% | 1,016,188 | 1,013,380 |
| 60% | 60.1% | 871,018 | 872,486 |
| 50% | 50.1% | 725,849 | 726,917 |
| 40% | 40.2% | 580,679 | 582,874 |
| 30% | 30.0% | 435,509 | 435,020 |
| 20% | 19.9% | 290,339 | 289,278 |
| 10% | 10.1% | 145,170 | 146,022 |
| Active Idle | 0 | 0 | |
| Target Load | Actual Load | ssj_ops | |
|---|---|---|---|
| Target | Actual | ||
| Calibration 1 | 1,438,909 | ||
| Calibration 2 | 1,436,672 | ||
| Calibration 3 | 1,437,550 | ||
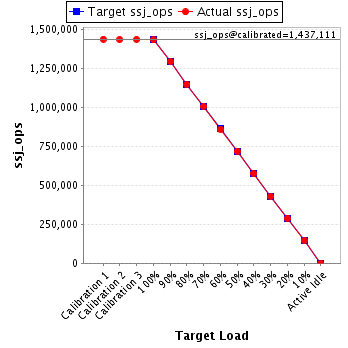
| ssj_ops@calibrated=1,437,111 | |||
| 100% | 99.8% | 1,437,111 | 1,434,538 |
| 90% | 90.1% | 1,293,400 | 1,295,258 |
| 80% | 80.0% | 1,149,689 | 1,149,224 |
| 70% | 70.1% | 1,005,977 | 1,007,903 |
| 60% | 60.0% | 862,266 | 862,011 |
| 50% | 50.1% | 718,555 | 719,961 |
| 40% | 40.0% | 574,844 | 575,451 |
| 30% | 29.9% | 431,133 | 430,223 |
| 20% | 20.1% | 287,422 | 288,192 |
| 10% | 10.1% | 143,711 | 145,501 |
| Active Idle | 0 | 0 | |