
SPECpower_ssj2008
Host 'NODE01' Performance Report
Copyright © 2007-2019 Standard Performance Evaluation Corporation
| Hewlett Packard Enterprise Synergy 480 Gen10 Compute Module | ssj_ops@100% = 5,746,113 ssj_ops@100% per JVM = 1,436,528 |
||||
| Test Sponsor: | Hewlett Packard Enterprise | SPEC License #: | 3 | Test Method: | Multi Node |
| Tested By: | Hewlett Packard Enterprise | Test Location: | Houston, TX, USA | Test Date: | Mar 26, 2019 |
| Hardware Availability: | Apr-2019 | Software Availability: | Mar-2019 | Publication: | May 8, 2019 |
| System Source: | Single Supplier | System Designation: | Server | Power Provisioning: | Line-powered |
| Target Load | Actual Load | ssj_ops | |
|---|---|---|---|
| Target | Actual | ||
| Calibration 1 | 5,770,684 | ||
| Calibration 2 | 5,758,426 | ||
| Calibration 3 | 5,764,777 | ||
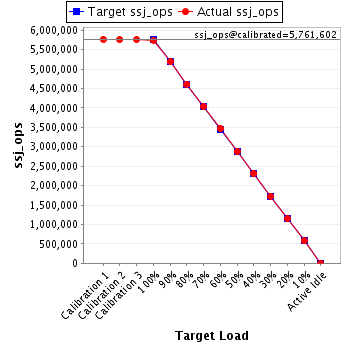
| ssj_ops@calibrated=5,761,602 | |||
| 100% | 99.7% | 5,761,602 | 5,746,113 |
| 90% | 90.1% | 5,185,441 | 5,190,880 |
| 80% | 80.1% | 4,609,281 | 4,614,506 |
| 70% | 70.0% | 4,033,121 | 4,032,235 |
| 60% | 60.1% | 3,456,961 | 3,462,649 |
| 50% | 50.0% | 2,880,801 | 2,880,719 |
| 40% | 40.0% | 2,304,641 | 2,304,112 |
| 30% | 30.0% | 1,728,480 | 1,727,871 |
| 20% | 20.0% | 1,152,320 | 1,150,445 |
| 10% | 10.0% | 576,160 | 577,985 |
| Active Idle | 0 | 0 | |
| Set Identifier: | SUT |
| Set Description: | System Under Test |
| # of Identical Nodes: | 6 |
| Comment: | SUT |
| Hardware | |
|---|---|
| Hardware Vendor: | Hewlett Packard Enterprise |
| Model: | Synergy 480 Gen10 Compute Module |
| Form Factor: | 7U |
| CPU Name: | Intel Xeon Platinum 8280 @ 2.70GHz (Intel Turbo Boost Technology up to 4.00 GHz) |
| CPU Characteristics: | 28-Core, 2.70 GHz, 38.5MB L3 Cache |
| CPU Frequency (MHz): | 2700 |
| CPU(s) Enabled: | 56 cores, 2 chips, 28 cores/chip |
| Hardware Threads: | 112 (2 / core) |
| CPU(s) Orderable: | 1,2 chips |
| Primary Cache: | 32 KB I + 32 KB D on chip per core |
| Secondary Cache: | 1 MB I+D on chip per core |
| Tertiary Cache: | 39424 KB I+D on chip per chip |
| Other Cache: | None |
| Memory Amount (GB): | 192 |
| # and size of DIMM: | 12 x 16384 MB |
| Memory Details: | 12 x 16GB 2Rx8 PC4-2933Y-R; slots 1, 3, 5, 8, 10 and 12 populated in each socket |
| Power Supply Quantity and Rating (W): | None |
| Power Supply Details: | N/A |
| Disk Drive: | 1 x HPE 240GB 6G SATA M.2 SSD (875488-B21) |
| Disk Controller: | HPE Smart Array S100i SR Gen10 |
| # and type of Network Interface Cards (NICs) Installed: | 1 x HPE Synergy 3820C 10/20Gb CNA |
| NICs Enabled in Firmware / OS / Connected: | 2/2/1 |
| Network Speed (Mbit): | 1000 |
| Keyboard: | None |
| Mouse: | None |
| Monitor: | None |
| Optical Drives: | No |
| Other Hardware: | H/S: Standard |
| Software | |
|---|---|
| Power Management: | Enabled (see SUT Notes) |
| Operating System (OS): | Windows Server 2012 R2 Datacenter |
| OS Version: | Version 6.3 (Build 9600) |
| Filesystem: | NTFS |
| JVM Vendor: | Oracle Corporation |
| JVM Version: | Oracle Java HotSpot(TM) 64-Bit Server VM (build 24.80-b11, mixed mode), version 1.7.0_80 |
| JVM Command-line Options: | -server -Xmn21000m -Xms24000m -Xmx24000m -XX:SurvivorRatio=1 -XX:TargetSurvivorRatio=99 -XX:AllocatePrefetchDistance=256 -XX:AllocatePrefetchLines=4 -XX:LoopUnrollLimit=45 -XX:InitialTenuringThreshold=12 -XX:MaxTenuringThreshold=15 -XX:ParallelGCThreads=28 -XX:InlineSmallCode=3900 -XX:MaxInlineSize=270 -XX:FreqInlineSize=2500 -XX:+AggressiveOpts -XX:+UseLargePages -XX:+UseParallelOldGC |
| JVM Affinity: | start /NODE [0,1,2,3] /AFFINITY [0xFFFFFFF] |
| JVM Instances: | 4 |
| JVM Initial Heap (MB): | 24000 |
| JVM Maximum Heap (MB): | 24000 |
| JVM Address Bits: | 64 |
| Boot Firmware Version: | I42 v2.00 (02/02/2019) |
| Management Firmware Version: | 1.40 Feb 05 2019 |
| Workload Version: | SSJ 1.2.10 |
| Director Location: | Controller |
| Other Software: | HPE Service Pack for ProLiant (SPP) Version: 2019.03.0, Microsoft Windows KB4056898, KB4338815 |
| JVM Instance | ssj_ops@100% |
|---|---|
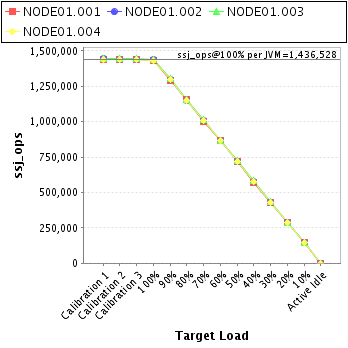
| NODE01.001 | 1,433,725 |
| NODE01.002 | 1,437,145 |
| NODE01.003 | 1,441,675 |
| NODE01.004 | 1,433,567 |
| ssj_ops@100% | 5,746,113 |
| ssj_ops@100% per JVM | 1,436,528 |
| Target Load | Actual Load | ssj_ops | |
|---|---|---|---|
| Target | Actual | ||
| Calibration 1 | 1,442,071 | ||
| Calibration 2 | 1,437,167 | ||
| Calibration 3 | 1,438,791 | ||
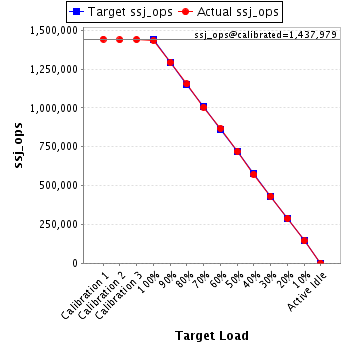
| ssj_ops@calibrated=1,437,979 | |||
| 100% | 99.7% | 1,437,979 | 1,433,725 |
| 90% | 89.9% | 1,294,181 | 1,293,435 |
| 80% | 80.2% | 1,150,383 | 1,153,695 |
| 70% | 69.9% | 1,006,585 | 1,004,466 |
| 60% | 60.4% | 862,787 | 867,922 |
| 50% | 50.0% | 718,989 | 718,928 |
| 40% | 39.8% | 575,192 | 572,082 |
| 30% | 30.0% | 431,394 | 431,902 |
| 20% | 20.0% | 287,596 | 288,269 |
| 10% | 10.0% | 143,798 | 144,361 |
| Active Idle | 0 | 0 | |
| Target Load | Actual Load | ssj_ops | |
|---|---|---|---|
| Target | Actual | ||
| Calibration 1 | 1,443,464 | ||
| Calibration 2 | 1,437,792 | ||
| Calibration 3 | 1,439,246 | ||
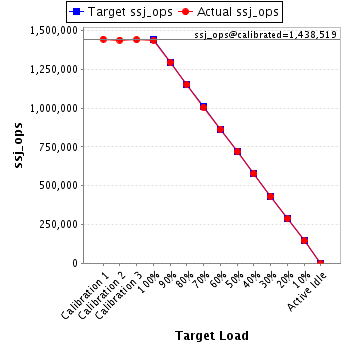
| ssj_ops@calibrated=1,438,519 | |||
| 100% | 99.9% | 1,438,519 | 1,437,145 |
| 90% | 90.0% | 1,294,667 | 1,294,377 |
| 80% | 80.0% | 1,150,815 | 1,151,147 |
| 70% | 69.9% | 1,006,964 | 1,005,115 |
| 60% | 60.1% | 863,112 | 864,310 |
| 50% | 50.0% | 719,260 | 719,149 |
| 40% | 40.1% | 575,408 | 576,228 |
| 30% | 29.9% | 431,556 | 430,004 |
| 20% | 20.0% | 287,704 | 287,627 |
| 10% | 10.1% | 143,852 | 144,620 |
| Active Idle | 0 | 0 | |
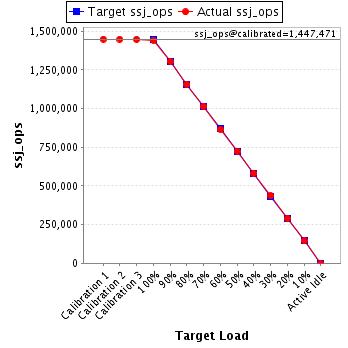
| Target Load | Actual Load | ssj_ops | |
|---|---|---|---|
| Target | Actual | ||
| Calibration 1 | 1,448,172 | ||
| Calibration 2 | 1,447,502 | ||
| Calibration 3 | 1,447,440 | ||
| ssj_ops@calibrated=1,447,471 | |||
| 100% | 99.6% | 1,447,471 | 1,441,675 |
| 90% | 90.1% | 1,302,724 | 1,304,019 |
| 80% | 80.0% | 1,157,976 | 1,157,284 |
| 70% | 70.2% | 1,013,229 | 1,015,782 |
| 60% | 59.9% | 868,482 | 866,520 |
| 50% | 50.1% | 723,735 | 725,298 |
| 40% | 40.2% | 578,988 | 581,233 |
| 30% | 30.1% | 434,241 | 435,660 |
| 20% | 19.9% | 289,494 | 288,232 |
| 10% | 10.0% | 144,747 | 144,842 |
| Active Idle | 0 | 0 | |
| Target Load | Actual Load | ssj_ops | |
|---|---|---|---|
| Target | Actual | ||
| Calibration 1 | 1,436,977 | ||
| Calibration 2 | 1,435,965 | ||
| Calibration 3 | 1,439,300 | ||
| ssj_ops@calibrated=1,437,633 | |||
| 100% | 99.7% | 1,437,633 | 1,433,567 |
| 90% | 90.4% | 1,293,870 | 1,299,050 |
| 80% | 80.2% | 1,150,106 | 1,152,379 |
| 70% | 70.0% | 1,006,343 | 1,006,872 |
| 60% | 60.1% | 862,580 | 863,896 |
| 50% | 49.9% | 718,816 | 717,345 |
| 40% | 40.0% | 575,053 | 574,569 |
| 30% | 29.9% | 431,290 | 430,305 |
| 20% | 19.9% | 287,527 | 286,317 |
| 10% | 10.0% | 143,763 | 144,163 |
| Active Idle | 0 | 0 | |
