SPECpower_ssj2008
Host 'sles15sp2-3' Performance Report
Copyright © 2007-2021 Standard Performance Evaluation Corporation
| Fujitsu FUJITSU Server PRIMERGY CX2560 M6 | ssj_ops@100% = 4,909,458 ssj_ops@100% per JVM = 1,227,364 |
||||
| Test Sponsor: | Fujitsu | SPEC License #: | 19 | Test Method: | Multi Node |
| Tested By: | Fujitsu | Test Location: | Kawasaki, Kanagawa, Japan | Test Date: | Aug 6, 2021 |
| Hardware Availability: | Sep-2021 | Software Availability: | Dec-2020 | Publication: | Sep 1, 2021 |
| System Source: | Single Supplier | System Designation: | Server | Power Provisioning: | Line-powered |
| Target Load | Actual Load | ssj_ops | |
|---|---|---|---|
| Target | Actual | ||
| Calibration 1 | 3,599,554 | ||
| Calibration 2 | 4,945,006 | ||
| Calibration 3 | 4,923,086 | ||
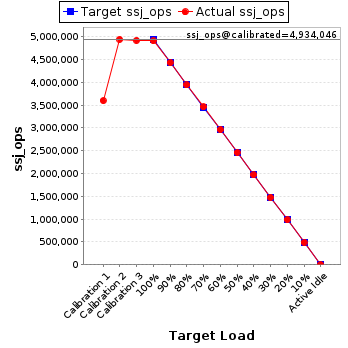
| ssj_ops@calibrated=4,934,046 | |||
| 100% | 99.5% | 4,934,046 | 4,909,458 |
| 90% | 89.9% | 4,440,641 | 4,435,401 |
| 80% | 79.9% | 3,947,237 | 3,943,860 |
| 70% | 70.2% | 3,453,832 | 3,463,803 |
| 60% | 60.1% | 2,960,428 | 2,963,617 |
| 50% | 49.9% | 2,467,023 | 2,462,354 |
| 40% | 39.9% | 1,973,618 | 1,969,746 |
| 30% | 30.0% | 1,480,214 | 1,479,921 |
| 20% | 20.0% | 986,809 | 986,907 |
| 10% | 10.0% | 493,405 | 491,118 |
| Active Idle | 0 | 0 | |
| Set Identifier: | CX2560M6 |
| Set Description: | System Under Test |
| # of Identical Nodes: | 4 |
| Comment: | Multi Node |
| Hardware | |
|---|---|
| Hardware Vendor: | Fujitsu |
| Model: | FUJITSU Server PRIMERGY CX2560 M6 |
| Form Factor: | Blade |
| CPU Name: | Intel Xeon Gold 5318Y |
| CPU Characteristics: | 24-Core, 2.10GHz, 36MB L3 Cache |
| CPU Frequency (MHz): | 2100 |
| CPU(s) Enabled: | 48 cores, 2 chips, 24 cores/chip |
| Hardware Threads: | 96 (2 / core) |
| CPU(s) Orderable: | 1,2 chips |
| Primary Cache: | 32 KB I + 48 KB D on chip per core |
| Secondary Cache: | 1280 KB I+D on chip per core |
| Tertiary Cache: | 36 MB I+D on chip per chip |
| Other Cache: | None |
| Memory Amount (GB): | 256 |
| # and size of DIMM: | 16 x 16384 MB |
| Memory Details: | 16 x 16 GB 2Rx8 PC4-3200Y-R; slots 1A, 1B, 1C, 1D, 1E, 1F, 1G, 1H, 1J, 1K, 1L, 1M, 1N, 1P, 1Q, 1R populated |
| Power Supply Quantity and Rating (W): | None |
| Power Supply Details: | N/A |
| Disk Drive: | 1 x SSD M.2 240GB, S26361-F5787-E240 |
| Disk Controller: | Integrated sSATA Controller |
| # and type of Network Interface Cards (NICs) Installed: | 1 x Intel(R) 10Gb X550T Gigabit Network Connection (onboard) |
| NICs Enabled in Firmware / OS / Connected: | 1/1/1 |
| Network Speed (Mbit): | 10000 |
| Keyboard: | None |
| Mouse: | None |
| Monitor: | None |
| Optical Drives: | No |
| Other Hardware: | None |
| Software | |
|---|---|
| Power Management: | Enabled (see SUT Notes) |
| Operating System (OS): | SUSE Linux Enterprise Server 15 SP2 |
| OS Version: | 5.3.18-24.43-default |
| Filesystem: | btrfs |
| JVM Vendor: | Oracle Corporation |
| JVM Version: | Oracle Java HotSpot(TM) 64-Bit Server VM 18.9 (build 11.0.9+7-LTS, mixed mode) |
| JVM Command-line Options: | -server -Xmn20000m -Xms22000m -Xmx22000m -XX:+UseHugeTLBFS -XX:+UseLargePages -XX:+UseTransparentHugePages -XX:AllocatePrefetchDistance=256 -XX:AllocatePrefetchInstr=0 -XX:AllocatePrefetchLines=4 -XX:InlineSmallCode=3900 -XX:MaxInlineSize=270 -XX:ParallelGCThreads=8 -XX:SurvivorRatio=1 -XX:TargetSurvivorRatio=99 -XX:+UseParallelOldGC -XX:FreqInlineSize=2500 -XX:MinJumpTableSize=18 -XX:UseAVX=0 -XX:+UseBiasedLocking |
| JVM Affinity: | chrt -r 1 taskset -c [(0,1,2,3,4,5,6,7,8,9,10,11,48,49,50,51,52,53,54,55,56,57,58), (12,13,14,15,16,17,18,19,20,21,22,23,60,61,62,63,64,65,66,67,68,69,70), (24,25,26,27,28,29,30,31,32,33,34,35,72,73,74,75,76,77,78,79,80,81,82), (36,37,38,39,40,41,42,43,44,45,46,47,84,85,86,87,88,89,90,91,92,93,94)] numactl --membind=[0-3] |
| JVM Instances: | 4 |
| JVM Initial Heap (MB): | 22000 |
| JVM Maximum Heap (MB): | 22000 |
| JVM Address Bits: | 64 |
| Boot Firmware Version: | R1.23.0 |
| Management Firmware Version: | 3.26P |
| Workload Version: | SSJ 1.2.10 |
| Director Location: | Controller |
| Other Software: | None |
| JVM Instance | ssj_ops@100% |
|---|---|
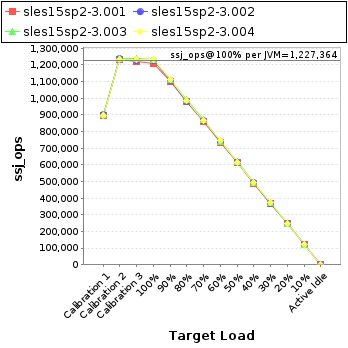
| sles15sp2-3.001 | 1,211,603 |
| sles15sp2-3.002 | 1,227,998 |
| sles15sp2-3.003 | 1,234,881 |
| sles15sp2-3.004 | 1,234,976 |
| ssj_ops@100% | 4,909,458 |
| ssj_ops@100% per JVM | 1,227,364 |
| Target Load | Actual Load | ssj_ops | |
|---|---|---|---|
| Target | Actual | ||
| Calibration 1 | 896,982 | ||
| Calibration 2 | 1,230,992 | ||
| Calibration 3 | 1,222,636 | ||
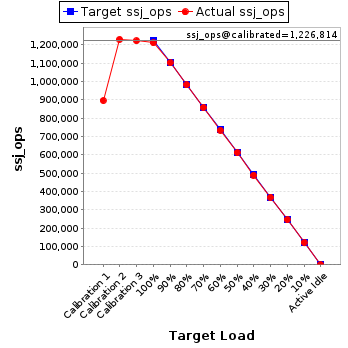
| ssj_ops@calibrated=1,226,814 | |||
| 100% | 98.8% | 1,226,814 | 1,211,603 |
| 90% | 89.9% | 1,104,133 | 1,103,122 |
| 80% | 80.1% | 981,451 | 982,897 |
| 70% | 70.1% | 858,770 | 859,492 |
| 60% | 59.9% | 736,088 | 734,713 |
| 50% | 50.0% | 613,407 | 612,895 |
| 40% | 39.9% | 490,726 | 489,447 |
| 30% | 30.1% | 368,044 | 369,391 |
| 20% | 20.1% | 245,363 | 246,440 |
| 10% | 9.9% | 122,681 | 121,607 |
| Active Idle | 0 | 0 | |
| Target Load | Actual Load | ssj_ops | |
|---|---|---|---|
| Target | Actual | ||
| Calibration 1 | 901,360 | ||
| Calibration 2 | 1,238,316 | ||
| Calibration 3 | 1,228,285 | ||
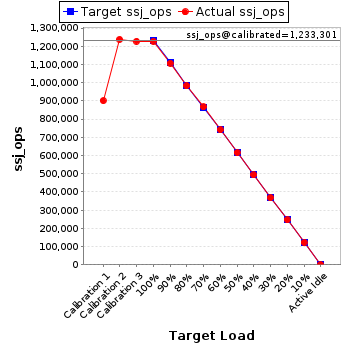
| ssj_ops@calibrated=1,233,301 | |||
| 100% | 99.6% | 1,233,301 | 1,227,998 |
| 90% | 89.8% | 1,109,970 | 1,107,252 |
| 80% | 79.7% | 986,640 | 983,245 |
| 70% | 70.3% | 863,310 | 867,060 |
| 60% | 60.1% | 739,980 | 740,789 |
| 50% | 49.9% | 616,650 | 615,926 |
| 40% | 40.0% | 493,320 | 493,086 |
| 30% | 29.8% | 369,990 | 367,551 |
| 20% | 20.0% | 246,660 | 246,309 |
| 10% | 10.0% | 123,330 | 122,820 |
| Active Idle | 0 | 0 | |
| Target Load | Actual Load | ssj_ops | |
|---|---|---|---|
| Target | Actual | ||
| Calibration 1 | 902,860 | ||
| Calibration 2 | 1,240,172 | ||
| Calibration 3 | 1,236,573 | ||
| ssj_ops@calibrated=1,238,372 | |||
| 100% | 99.7% | 1,238,372 | 1,234,881 |
| 90% | 89.8% | 1,114,535 | 1,112,149 |
| 80% | 80.1% | 990,698 | 992,127 |
| 70% | 70.2% | 866,861 | 869,276 |
| 60% | 59.8% | 743,023 | 740,378 |
| 50% | 49.9% | 619,186 | 618,245 |
| 40% | 40.0% | 495,349 | 495,133 |
| 30% | 30.0% | 371,512 | 371,992 |
| 20% | 20.0% | 247,674 | 247,669 |
| 10% | 9.9% | 123,837 | 122,915 |
| Active Idle | 0 | 0 | |

| Target Load | Actual Load | ssj_ops | |
|---|---|---|---|
| Target | Actual | ||
| Calibration 1 | 898,351 | ||
| Calibration 2 | 1,235,526 | ||
| Calibration 3 | 1,235,592 | ||
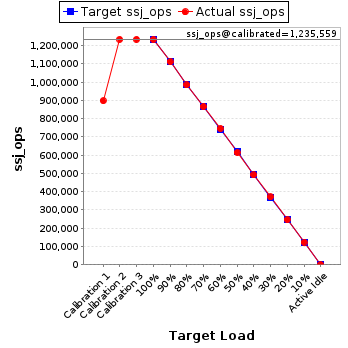
| ssj_ops@calibrated=1,235,559 | |||
| 100% | 100.0% | 1,235,559 | 1,234,976 |
| 90% | 90.1% | 1,112,003 | 1,112,878 |
| 80% | 79.8% | 988,447 | 985,591 |
| 70% | 70.2% | 864,891 | 867,975 |
| 60% | 60.5% | 741,335 | 747,737 |
| 50% | 49.8% | 617,779 | 615,289 |
| 40% | 39.8% | 494,224 | 492,080 |
| 30% | 30.0% | 370,668 | 370,987 |
| 20% | 19.9% | 247,112 | 246,489 |
| 10% | 10.0% | 123,556 | 123,777 |
| Active Idle | 0 | 0 | |