SPECpower_ssj2008
Host 'sles15sp2-4' Performance Report
Copyright © 2007-2021 Standard Performance Evaluation Corporation
| Fujitsu FUJITSU Server PRIMERGY CX2560 M6 | ssj_ops@100% = 4,950,523 ssj_ops@100% per JVM = 1,237,631 |
||||
| Test Sponsor: | Fujitsu | SPEC License #: | 19 | Test Method: | Multi Node |
| Tested By: | Fujitsu | Test Location: | Kawasaki, Kanagawa, Japan | Test Date: | Aug 6, 2021 |
| Hardware Availability: | Sep-2021 | Software Availability: | Dec-2020 | Publication: | Sep 1, 2021 |
| System Source: | Single Supplier | System Designation: | Server | Power Provisioning: | Line-powered |
| Target Load | Actual Load | ssj_ops | |
|---|---|---|---|
| Target | Actual | ||
| Calibration 1 | 3,636,907 | ||
| Calibration 2 | 4,959,985 | ||
| Calibration 3 | 4,959,153 | ||
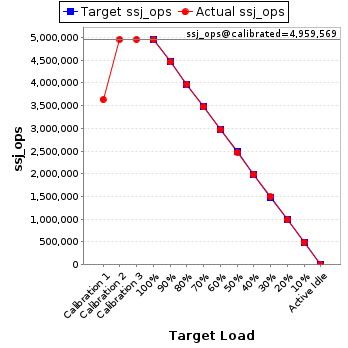
| ssj_ops@calibrated=4,959,569 | |||
| 100% | 99.8% | 4,959,569 | 4,950,523 |
| 90% | 89.9% | 4,463,612 | 4,459,696 |
| 80% | 80.1% | 3,967,655 | 3,974,094 |
| 70% | 70.0% | 3,471,698 | 3,470,907 |
| 60% | 60.0% | 2,975,741 | 2,975,392 |
| 50% | 50.0% | 2,479,784 | 2,478,188 |
| 40% | 40.0% | 1,983,828 | 1,986,258 |
| 30% | 30.0% | 1,487,871 | 1,489,272 |
| 20% | 20.0% | 991,914 | 992,618 |
| 10% | 10.0% | 495,957 | 494,605 |
| Active Idle | 0 | 0 | |
| Set Identifier: | CX2560M6 |
| Set Description: | System Under Test |
| # of Identical Nodes: | 4 |
| Comment: | Multi Node |
| Hardware | |
|---|---|
| Hardware Vendor: | Fujitsu |
| Model: | FUJITSU Server PRIMERGY CX2560 M6 |
| Form Factor: | Blade |
| CPU Name: | Intel Xeon Gold 5318Y |
| CPU Characteristics: | 24-Core, 2.10GHz, 36MB L3 Cache |
| CPU Frequency (MHz): | 2100 |
| CPU(s) Enabled: | 48 cores, 2 chips, 24 cores/chip |
| Hardware Threads: | 96 (2 / core) |
| CPU(s) Orderable: | 1,2 chips |
| Primary Cache: | 32 KB I + 48 KB D on chip per core |
| Secondary Cache: | 1280 KB I+D on chip per core |
| Tertiary Cache: | 36 MB I+D on chip per chip |
| Other Cache: | None |
| Memory Amount (GB): | 256 |
| # and size of DIMM: | 16 x 16384 MB |
| Memory Details: | 16 x 16 GB 2Rx8 PC4-3200Y-R; slots 1A, 1B, 1C, 1D, 1E, 1F, 1G, 1H, 1J, 1K, 1L, 1M, 1N, 1P, 1Q, 1R populated |
| Power Supply Quantity and Rating (W): | None |
| Power Supply Details: | N/A |
| Disk Drive: | 1 x SSD M.2 240GB, S26361-F5787-E240 |
| Disk Controller: | Integrated sSATA Controller |
| # and type of Network Interface Cards (NICs) Installed: | 1 x Intel(R) 10Gb X550T Gigabit Network Connection (onboard) |
| NICs Enabled in Firmware / OS / Connected: | 1/1/1 |
| Network Speed (Mbit): | 10000 |
| Keyboard: | None |
| Mouse: | None |
| Monitor: | None |
| Optical Drives: | No |
| Other Hardware: | None |
| Software | |
|---|---|
| Power Management: | Enabled (see SUT Notes) |
| Operating System (OS): | SUSE Linux Enterprise Server 15 SP2 |
| OS Version: | 5.3.18-24.43-default |
| Filesystem: | btrfs |
| JVM Vendor: | Oracle Corporation |
| JVM Version: | Oracle Java HotSpot(TM) 64-Bit Server VM 18.9 (build 11.0.9+7-LTS, mixed mode) |
| JVM Command-line Options: | -server -Xmn20000m -Xms22000m -Xmx22000m -XX:+UseHugeTLBFS -XX:+UseLargePages -XX:+UseTransparentHugePages -XX:AllocatePrefetchDistance=256 -XX:AllocatePrefetchInstr=0 -XX:AllocatePrefetchLines=4 -XX:InlineSmallCode=3900 -XX:MaxInlineSize=270 -XX:ParallelGCThreads=8 -XX:SurvivorRatio=1 -XX:TargetSurvivorRatio=99 -XX:+UseParallelOldGC -XX:FreqInlineSize=2500 -XX:MinJumpTableSize=18 -XX:UseAVX=0 -XX:+UseBiasedLocking |
| JVM Affinity: | chrt -r 1 taskset -c [(0,1,2,3,4,5,6,7,8,9,10,11,48,49,50,51,52,53,54,55,56,57,58), (12,13,14,15,16,17,18,19,20,21,22,23,60,61,62,63,64,65,66,67,68,69,70), (24,25,26,27,28,29,30,31,32,33,34,35,72,73,74,75,76,77,78,79,80,81,82), (36,37,38,39,40,41,42,43,44,45,46,47,84,85,86,87,88,89,90,91,92,93,94)] numactl --membind=[0-3] |
| JVM Instances: | 4 |
| JVM Initial Heap (MB): | 22000 |
| JVM Maximum Heap (MB): | 22000 |
| JVM Address Bits: | 64 |
| Boot Firmware Version: | R1.23.0 |
| Management Firmware Version: | 3.26P |
| Workload Version: | SSJ 1.2.10 |
| Director Location: | Controller |
| Other Software: | None |
| JVM Instance | ssj_ops@100% |
|---|---|
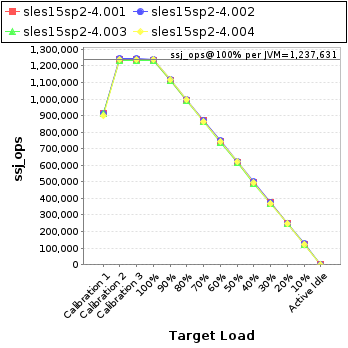
| sles15sp2-4.001 | 1,235,748 |
| sles15sp2-4.002 | 1,241,531 |
| sles15sp2-4.003 | 1,233,927 |
| sles15sp2-4.004 | 1,239,317 |
| ssj_ops@100% | 4,950,523 |
| ssj_ops@100% per JVM | 1,237,631 |
| Target Load | Actual Load | ssj_ops | |
|---|---|---|---|
| Target | Actual | ||
| Calibration 1 | 916,043 | ||
| Calibration 2 | 1,237,763 | ||
| Calibration 3 | 1,239,660 | ||
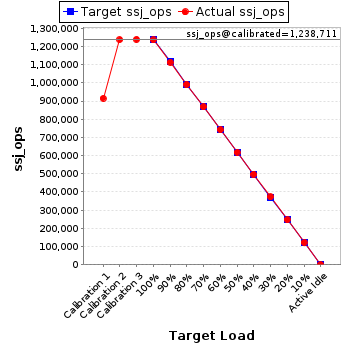
| ssj_ops@calibrated=1,238,711 | |||
| 100% | 99.8% | 1,238,711 | 1,235,748 |
| 90% | 89.9% | 1,114,840 | 1,113,659 |
| 80% | 80.1% | 990,969 | 991,647 |
| 70% | 70.1% | 867,098 | 868,422 |
| 60% | 59.9% | 743,227 | 742,324 |
| 50% | 50.0% | 619,356 | 618,885 |
| 40% | 40.2% | 495,485 | 497,838 |
| 30% | 30.1% | 371,613 | 372,901 |
| 20% | 19.9% | 247,742 | 246,997 |
| 10% | 9.9% | 123,871 | 122,352 |
| Active Idle | 0 | 0 | |
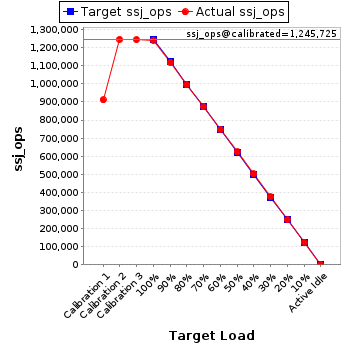
| Target Load | Actual Load | ssj_ops | |
|---|---|---|---|
| Target | Actual | ||
| Calibration 1 | 911,052 | ||
| Calibration 2 | 1,246,683 | ||
| Calibration 3 | 1,244,768 | ||
| ssj_ops@calibrated=1,245,725 | |||
| 100% | 99.7% | 1,245,725 | 1,241,531 |
| 90% | 89.9% | 1,121,153 | 1,119,527 |
| 80% | 80.0% | 996,580 | 996,166 |
| 70% | 70.0% | 872,008 | 872,422 |
| 60% | 60.1% | 747,435 | 749,129 |
| 50% | 50.0% | 622,863 | 623,417 |
| 40% | 40.3% | 498,290 | 501,636 |
| 30% | 30.1% | 373,718 | 375,215 |
| 20% | 20.0% | 249,145 | 249,000 |
| 10% | 10.0% | 124,573 | 124,977 |
| Active Idle | 0 | 0 | |
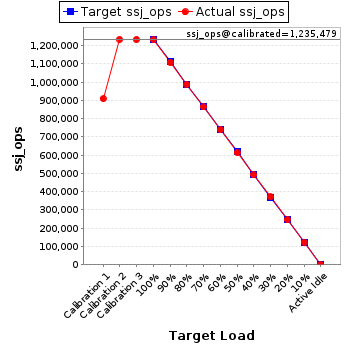
| Target Load | Actual Load | ssj_ops | |
|---|---|---|---|
| Target | Actual | ||
| Calibration 1 | 910,396 | ||
| Calibration 2 | 1,235,702 | ||
| Calibration 3 | 1,235,256 | ||
| ssj_ops@calibrated=1,235,479 | |||
| 100% | 99.9% | 1,235,479 | 1,233,927 |
| 90% | 89.9% | 1,111,931 | 1,110,542 |
| 80% | 80.1% | 988,383 | 989,746 |
| 70% | 70.0% | 864,835 | 864,807 |
| 60% | 59.9% | 741,287 | 740,061 |
| 50% | 49.7% | 617,739 | 614,452 |
| 40% | 39.9% | 494,192 | 492,687 |
| 30% | 30.0% | 370,644 | 371,031 |
| 20% | 20.0% | 247,096 | 247,414 |
| 10% | 10.0% | 123,548 | 123,484 |
| Active Idle | 0 | 0 | |
| Target Load | Actual Load | ssj_ops | |
|---|---|---|---|
| Target | Actual | ||
| Calibration 1 | 899,416 | ||
| Calibration 2 | 1,239,837 | ||
| Calibration 3 | 1,239,469 | ||
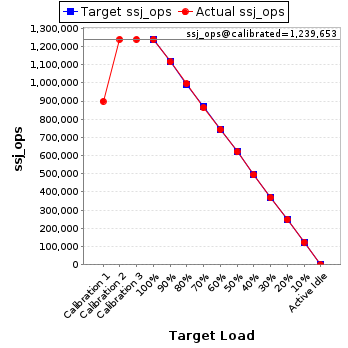
| ssj_ops@calibrated=1,239,653 | |||
| 100% | 100.0% | 1,239,653 | 1,239,317 |
| 90% | 90.0% | 1,115,688 | 1,115,969 |
| 80% | 80.4% | 991,723 | 996,535 |
| 70% | 69.8% | 867,757 | 865,256 |
| 60% | 60.0% | 743,792 | 743,879 |
| 50% | 50.1% | 619,827 | 621,434 |
| 40% | 39.9% | 495,861 | 494,097 |
| 30% | 29.9% | 371,896 | 370,125 |
| 20% | 20.1% | 247,931 | 249,207 |
| 10% | 10.0% | 123,965 | 123,792 |
| Active Idle | 0 | 0 | |