| Target Load |
Actual Load |
ssj_ops |
| Target |
Actual |
| Calibration 1 |
|
|
4,424,613 |
| Calibration 2 |
|
|
4,347,931 |
| Calibration 3 |
|
|
4,341,124 |
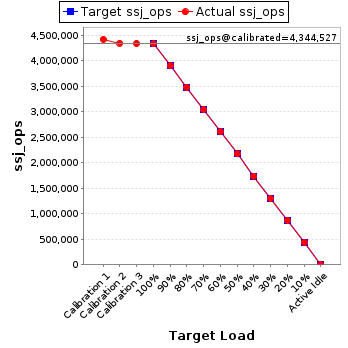
| ssj_ops@calibrated=4,344,527 |
| 100% |
99.7% |
4,344,527 |
4,333,105 |
| 90% |
89.9% |
3,910,074 |
3,907,339 |
| 80% |
80.2% |
3,475,622 |
3,483,845 |
| 70% |
70.0% |
3,041,169 |
3,043,057 |
| 60% |
60.0% |
2,606,716 |
2,606,564 |
| 50% |
50.0% |
2,172,264 |
2,172,414 |
| 40% |
40.0% |
1,737,811 |
1,737,902 |
| 30% |
29.9% |
1,303,358 |
1,299,751 |
| 20% |
20.1% |
868,905 |
872,613 |
| 10% |
10.0% |
434,453 |
435,175 |
| Active Idle |
|
0 |
0 |
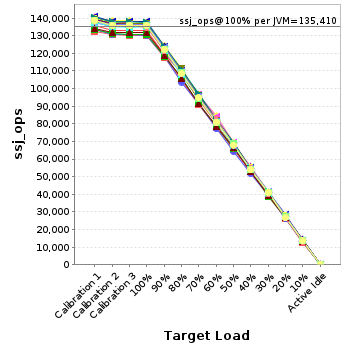
| JVM Instance |
ssj_ops@100% |
| localhost.001 |
130,232 |
| localhost.002 |
130,220 |
| localhost.003 |
136,047 |
| localhost.004 |
137,528 |
| localhost.005 |
135,689 |
| localhost.006 |
136,601 |
| localhost.007 |
136,253 |
| localhost.008 |
135,284 |
| localhost.009 |
135,056 |
| localhost.010 |
138,326 |
| localhost.011 |
130,829 |
| localhost.012 |
136,902 |
| localhost.013 |
135,952 |
| localhost.014 |
136,237 |
| localhost.015 |
135,566 |
| localhost.016 |
132,855 |
| localhost.017 |
135,548 |
| localhost.018 |
137,404 |
| localhost.019 |
136,433 |
| localhost.020 |
135,678 |
| localhost.021 |
135,291 |
| localhost.022 |
135,791 |
| localhost.023 |
131,654 |
| localhost.024 |
136,132 |
| localhost.025 |
135,562 |
| localhost.026 |
136,879 |
| localhost.027 |
136,587 |
| localhost.028 |
137,667 |
| localhost.029 |
134,881 |
| localhost.030 |
136,430 |
| localhost.031 |
135,906 |
| localhost.032 |
135,685 |
| ssj_ops@100% |
4,333,105 |
| ssj_ops@100% per JVM |
135,410 |
JVM 'localhost.001' Scores:
| Target Load |
Actual Load |
ssj_ops |
| Target |
Actual |
| Calibration 1 |
|
|
132,435 |
| Calibration 2 |
|
|
130,440 |
| Calibration 3 |
|
|
130,251 |
| ssj_ops@calibrated=130,345 |
| 100% |
99.9% |
130,345 |
130,232 |
| 90% |
90.2% |
117,311 |
117,624 |
| 80% |
80.3% |
104,276 |
104,714 |
| 70% |
69.9% |
91,242 |
91,090 |
| 60% |
59.8% |
78,207 |
77,999 |
| 50% |
50.0% |
65,173 |
65,233 |
| 40% |
40.4% |
52,138 |
52,662 |
| 30% |
29.8% |
39,104 |
38,879 |
| 20% |
20.2% |
26,069 |
26,300 |
| 10% |
9.7% |
13,035 |
12,708 |
| Active Idle |
|
0 |
0 |
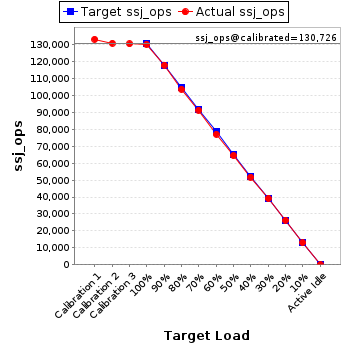
JVM 'localhost.002' Scores:
| Target Load |
Actual Load |
ssj_ops |
| Target |
Actual |
| Calibration 1 |
|
|
133,270 |
| Calibration 2 |
|
|
130,946 |
| Calibration 3 |
|
|
130,506 |
| ssj_ops@calibrated=130,726 |
| 100% |
99.6% |
130,726 |
130,220 |
| 90% |
90.2% |
117,653 |
117,973 |
| 80% |
79.3% |
104,581 |
103,713 |
| 70% |
69.9% |
91,508 |
91,343 |
| 60% |
59.0% |
78,436 |
77,159 |
| 50% |
49.3% |
65,363 |
64,443 |
| 40% |
39.6% |
52,290 |
51,817 |
| 30% |
30.0% |
39,218 |
39,190 |
| 20% |
20.1% |
26,145 |
26,339 |
| 10% |
10.0% |
13,073 |
13,021 |
| Active Idle |
|
0 |
0 |
JVM 'localhost.003' Scores:
| Target Load |
Actual Load |
ssj_ops |
| Target |
Actual |
| Calibration 1 |
|
|
137,821 |
| Calibration 2 |
|
|
136,689 |
| Calibration 3 |
|
|
136,151 |
| ssj_ops@calibrated=136,420 |
| 100% |
99.7% |
136,420 |
136,047 |
| 90% |
89.9% |
122,778 |
122,611 |
| 80% |
79.9% |
109,136 |
108,962 |
| 70% |
69.8% |
95,494 |
95,263 |
| 60% |
60.5% |
81,852 |
82,579 |
| 50% |
50.1% |
68,210 |
68,372 |
| 40% |
40.2% |
54,568 |
54,854 |
| 30% |
30.0% |
40,926 |
40,991 |
| 20% |
19.8% |
27,284 |
27,057 |
| 10% |
9.9% |
13,642 |
13,521 |
| Active Idle |
|
0 |
0 |
JVM 'localhost.004' Scores:
| Target Load |
Actual Load |
ssj_ops |
| Target |
Actual |
| Calibration 1 |
|
|
140,155 |
| Calibration 2 |
|
|
138,827 |
| Calibration 3 |
|
|
138,790 |
| ssj_ops@calibrated=138,809 |
| 100% |
99.1% |
138,809 |
137,528 |
| 90% |
89.9% |
124,928 |
124,735 |
| 80% |
80.2% |
111,047 |
111,276 |
| 70% |
69.2% |
97,166 |
96,113 |
| 60% |
61.0% |
83,285 |
84,657 |
| 50% |
49.9% |
69,404 |
69,251 |
| 40% |
39.8% |
55,524 |
55,224 |
| 30% |
29.6% |
41,643 |
41,152 |
| 20% |
20.0% |
27,762 |
27,737 |
| 10% |
10.0% |
13,881 |
13,846 |
| Active Idle |
|
0 |
0 |
JVM 'localhost.005' Scores:
| Target Load |
Actual Load |
ssj_ops |
| Target |
Actual |
| Calibration 1 |
|
|
138,519 |
| Calibration 2 |
|
|
136,041 |
| Calibration 3 |
|
|
135,902 |
| ssj_ops@calibrated=135,972 |
| 100% |
99.8% |
135,972 |
135,689 |
| 90% |
89.3% |
122,375 |
121,400 |
| 80% |
80.4% |
108,777 |
109,339 |
| 70% |
70.3% |
95,180 |
95,625 |
| 60% |
60.3% |
81,583 |
82,024 |
| 50% |
49.7% |
67,986 |
67,607 |
| 40% |
39.8% |
54,389 |
54,113 |
| 30% |
30.0% |
40,792 |
40,792 |
| 20% |
19.9% |
27,194 |
26,996 |
| 10% |
10.1% |
13,597 |
13,708 |
| Active Idle |
|
0 |
0 |
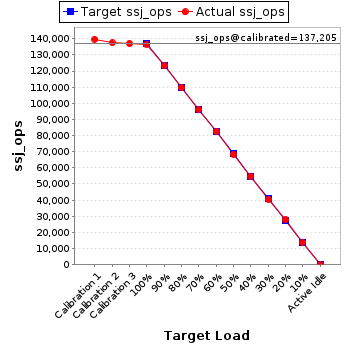
JVM 'localhost.006' Scores:
| Target Load |
Actual Load |
ssj_ops |
| Target |
Actual |
| Calibration 1 |
|
|
139,686 |
| Calibration 2 |
|
|
137,419 |
| Calibration 3 |
|
|
136,991 |
| ssj_ops@calibrated=137,205 |
| 100% |
99.6% |
137,205 |
136,601 |
| 90% |
89.8% |
123,485 |
123,228 |
| 80% |
80.0% |
109,764 |
109,715 |
| 70% |
70.2% |
96,044 |
96,251 |
| 60% |
60.2% |
82,323 |
82,635 |
| 50% |
49.8% |
68,603 |
68,337 |
| 40% |
40.0% |
54,882 |
54,932 |
| 30% |
29.6% |
41,162 |
40,550 |
| 20% |
20.2% |
27,441 |
27,701 |
| 10% |
10.0% |
13,721 |
13,734 |
| Active Idle |
|
0 |
0 |
JVM 'localhost.007' Scores:
| Target Load |
Actual Load |
ssj_ops |
| Target |
Actual |
| Calibration 1 |
|
|
139,715 |
| Calibration 2 |
|
|
137,296 |
| Calibration 3 |
|
|
136,808 |
| ssj_ops@calibrated=137,052 |
| 100% |
99.4% |
137,052 |
136,253 |
| 90% |
90.4% |
123,347 |
123,847 |
| 80% |
80.2% |
109,641 |
109,913 |
| 70% |
69.8% |
95,936 |
95,614 |
| 60% |
59.8% |
82,231 |
81,965 |
| 50% |
49.6% |
68,526 |
68,024 |
| 40% |
40.2% |
54,821 |
55,081 |
| 30% |
30.2% |
41,116 |
41,411 |
| 20% |
20.1% |
27,410 |
27,610 |
| 10% |
9.8% |
13,705 |
13,459 |
| Active Idle |
|
0 |
0 |
JVM 'localhost.008' Scores:
| Target Load |
Actual Load |
ssj_ops |
| Target |
Actual |
| Calibration 1 |
|
|
139,162 |
| Calibration 2 |
|
|
136,331 |
| Calibration 3 |
|
|
136,159 |
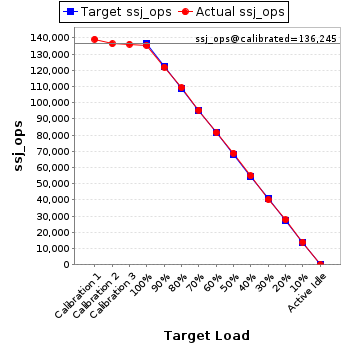
| ssj_ops@calibrated=136,245 |
| 100% |
99.3% |
136,245 |
135,284 |
| 90% |
89.5% |
122,621 |
121,928 |
| 80% |
80.2% |
108,996 |
109,215 |
| 70% |
70.0% |
95,372 |
95,366 |
| 60% |
59.8% |
81,747 |
81,519 |
| 50% |
50.5% |
68,123 |
68,810 |
| 40% |
40.2% |
54,498 |
54,784 |
| 30% |
29.5% |
40,874 |
40,162 |
| 20% |
20.3% |
27,249 |
27,673 |
| 10% |
10.3% |
13,625 |
13,992 |
| Active Idle |
|
0 |
0 |
JVM 'localhost.009' Scores:
| Target Load |
Actual Load |
ssj_ops |
| Target |
Actual |
| Calibration 1 |
|
|
138,956 |
| Calibration 2 |
|
|
136,129 |
| Calibration 3 |
|
|
136,121 |
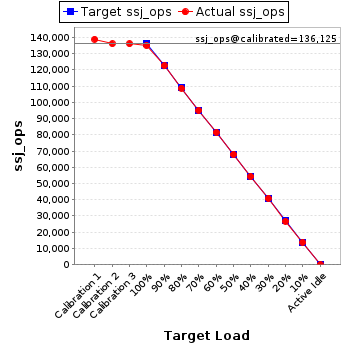
| ssj_ops@calibrated=136,125 |
| 100% |
99.2% |
136,125 |
135,056 |
| 90% |
90.1% |
122,513 |
122,613 |
| 80% |
80.0% |
108,900 |
108,838 |
| 70% |
69.9% |
95,288 |
95,134 |
| 60% |
60.0% |
81,675 |
81,610 |
| 50% |
49.9% |
68,063 |
67,952 |
| 40% |
39.9% |
54,450 |
54,312 |
| 30% |
30.1% |
40,838 |
40,908 |
| 20% |
19.7% |
27,225 |
26,750 |
| 10% |
10.2% |
13,613 |
13,850 |
| Active Idle |
|
0 |
0 |
JVM 'localhost.010' Scores:
| Target Load |
Actual Load |
ssj_ops |
| Target |
Actual |
| Calibration 1 |
|
|
140,971 |
| Calibration 2 |
|
|
138,177 |
| Calibration 3 |
|
|
138,153 |
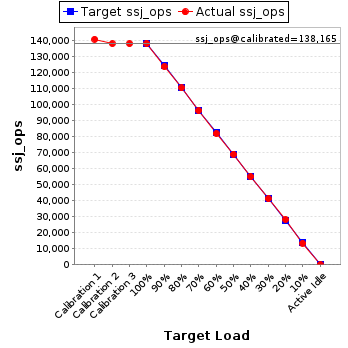
| ssj_ops@calibrated=138,165 |
| 100% |
100.1% |
138,165 |
138,326 |
| 90% |
89.6% |
124,349 |
123,770 |
| 80% |
80.0% |
110,532 |
110,504 |
| 70% |
69.7% |
96,716 |
96,329 |
| 60% |
59.3% |
82,899 |
81,978 |
| 50% |
50.0% |
69,083 |
69,081 |
| 40% |
39.8% |
55,266 |
54,971 |
| 30% |
29.9% |
41,450 |
41,260 |
| 20% |
20.5% |
27,633 |
28,271 |
| 10% |
9.7% |
13,817 |
13,417 |
| Active Idle |
|
0 |
0 |
JVM 'localhost.011' Scores:
| Target Load |
Actual Load |
ssj_ops |
| Target |
Actual |
| Calibration 1 |
|
|
133,336 |
| Calibration 2 |
|
|
131,167 |
| Calibration 3 |
|
|
130,745 |
| ssj_ops@calibrated=130,956 |
| 100% |
99.9% |
130,956 |
130,829 |
| 90% |
90.4% |
117,860 |
118,379 |
| 80% |
81.2% |
104,765 |
106,344 |
| 70% |
70.0% |
91,669 |
91,655 |
| 60% |
60.0% |
78,574 |
78,527 |
| 50% |
50.3% |
65,478 |
65,901 |
| 40% |
41.0% |
52,382 |
53,705 |
| 30% |
29.7% |
39,287 |
38,866 |
| 20% |
20.3% |
26,191 |
26,626 |
| 10% |
10.1% |
13,096 |
13,179 |
| Active Idle |
|
0 |
0 |
JVM 'localhost.012' Scores:
| Target Load |
Actual Load |
ssj_ops |
| Target |
Actual |
| Calibration 1 |
|
|
139,287 |
| Calibration 2 |
|
|
136,666 |
| Calibration 3 |
|
|
136,484 |
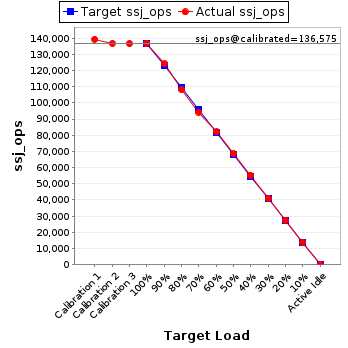
| ssj_ops@calibrated=136,575 |
| 100% |
100.2% |
136,575 |
136,902 |
| 90% |
90.9% |
122,918 |
124,116 |
| 80% |
79.3% |
109,260 |
108,322 |
| 70% |
68.9% |
95,603 |
94,097 |
| 60% |
60.1% |
81,945 |
82,014 |
| 50% |
50.2% |
68,288 |
68,552 |
| 40% |
40.4% |
54,630 |
55,233 |
| 30% |
30.0% |
40,973 |
40,980 |
| 20% |
20.0% |
27,315 |
27,308 |
| 10% |
10.2% |
13,658 |
13,912 |
| Active Idle |
|
0 |
0 |
JVM 'localhost.013' Scores:
| Target Load |
Actual Load |
ssj_ops |
| Target |
Actual |
| Calibration 1 |
|
|
140,281 |
| Calibration 2 |
|
|
137,736 |
| Calibration 3 |
|
|
137,628 |
| ssj_ops@calibrated=137,682 |
| 100% |
98.7% |
137,682 |
135,952 |
| 90% |
90.0% |
123,914 |
123,883 |
| 80% |
79.7% |
110,145 |
109,666 |
| 70% |
70.4% |
96,377 |
96,860 |
| 60% |
59.9% |
82,609 |
82,417 |
| 50% |
49.5% |
68,841 |
68,171 |
| 40% |
40.6% |
55,073 |
55,848 |
| 30% |
29.4% |
41,305 |
40,464 |
| 20% |
19.9% |
27,536 |
27,462 |
| 10% |
10.2% |
13,768 |
14,100 |
| Active Idle |
|
0 |
0 |
JVM 'localhost.014' Scores:
| Target Load |
Actual Load |
ssj_ops |
| Target |
Actual |
| Calibration 1 |
|
|
138,826 |
| Calibration 2 |
|
|
136,238 |
| Calibration 3 |
|
|
135,662 |
| ssj_ops@calibrated=135,950 |
| 100% |
100.2% |
135,950 |
136,237 |
| 90% |
89.8% |
122,355 |
122,027 |
| 80% |
80.2% |
108,760 |
109,095 |
| 70% |
69.6% |
95,165 |
94,608 |
| 60% |
59.5% |
81,570 |
80,865 |
| 50% |
49.6% |
67,975 |
67,392 |
| 40% |
39.9% |
54,380 |
54,253 |
| 30% |
30.1% |
40,785 |
40,883 |
| 20% |
20.3% |
27,190 |
27,578 |
| 10% |
9.9% |
13,595 |
13,525 |
| Active Idle |
|
0 |
0 |
JVM 'localhost.015' Scores:
| Target Load |
Actual Load |
ssj_ops |
| Target |
Actual |
| Calibration 1 |
|
|
138,498 |
| Calibration 2 |
|
|
135,937 |
| Calibration 3 |
|
|
135,755 |
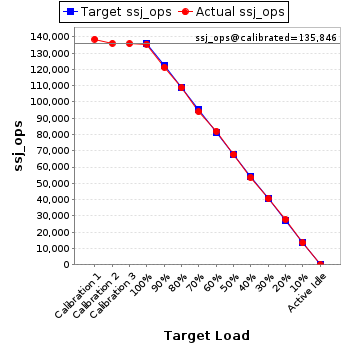
| ssj_ops@calibrated=135,846 |
| 100% |
99.8% |
135,846 |
135,566 |
| 90% |
89.2% |
122,262 |
121,223 |
| 80% |
80.0% |
108,677 |
108,667 |
| 70% |
69.2% |
95,092 |
94,024 |
| 60% |
60.3% |
81,508 |
81,971 |
| 50% |
49.8% |
67,923 |
67,600 |
| 40% |
39.5% |
54,338 |
53,623 |
| 30% |
29.9% |
40,754 |
40,577 |
| 20% |
20.5% |
27,169 |
27,829 |
| 10% |
9.9% |
13,585 |
13,458 |
| Active Idle |
|
0 |
0 |
JVM 'localhost.016' Scores:
| Target Load |
Actual Load |
ssj_ops |
| Target |
Actual |
| Calibration 1 |
|
|
136,049 |
| Calibration 2 |
|
|
133,184 |
| Calibration 3 |
|
|
133,130 |
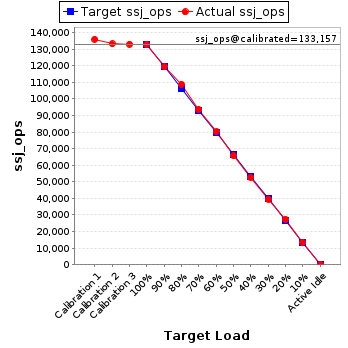
| ssj_ops@calibrated=133,157 |
| 100% |
99.8% |
133,157 |
132,855 |
| 90% |
89.7% |
119,842 |
119,477 |
| 80% |
81.8% |
106,526 |
108,929 |
| 70% |
70.4% |
93,210 |
93,734 |
| 60% |
60.2% |
79,894 |
80,187 |
| 50% |
49.4% |
66,579 |
65,772 |
| 40% |
39.6% |
53,263 |
52,782 |
| 30% |
29.7% |
39,947 |
39,600 |
| 20% |
20.6% |
26,631 |
27,433 |
| 10% |
10.2% |
13,316 |
13,529 |
| Active Idle |
|
0 |
0 |
JVM 'localhost.017' Scores:
| Target Load |
Actual Load |
ssj_ops |
| Target |
Actual |
| Calibration 1 |
|
|
137,789 |
| Calibration 2 |
|
|
135,288 |
| Calibration 3 |
|
|
135,293 |
| ssj_ops@calibrated=135,290 |
| 100% |
100.2% |
135,290 |
135,548 |
| 90% |
90.1% |
121,761 |
121,942 |
| 80% |
79.7% |
108,232 |
107,775 |
| 70% |
70.4% |
94,703 |
95,283 |
| 60% |
60.4% |
81,174 |
81,706 |
| 50% |
50.4% |
67,645 |
68,215 |
| 40% |
40.1% |
54,116 |
54,250 |
| 30% |
29.9% |
40,587 |
40,454 |
| 20% |
19.9% |
27,058 |
26,989 |
| 10% |
9.8% |
13,529 |
13,280 |
| Active Idle |
|
0 |
0 |
JVM 'localhost.018' Scores:
| Target Load |
Actual Load |
ssj_ops |
| Target |
Actual |
| Calibration 1 |
|
|
139,641 |
| Calibration 2 |
|
|
137,386 |
| Calibration 3 |
|
|
137,099 |
| ssj_ops@calibrated=137,243 |
| 100% |
100.1% |
137,243 |
137,404 |
| 90% |
89.9% |
123,518 |
123,377 |
| 80% |
79.5% |
109,794 |
109,127 |
| 70% |
71.0% |
96,070 |
97,408 |
| 60% |
59.7% |
82,346 |
81,997 |
| 50% |
50.2% |
68,621 |
68,848 |
| 40% |
39.4% |
54,897 |
54,068 |
| 30% |
30.3% |
41,173 |
41,638 |
| 20% |
20.1% |
27,449 |
27,621 |
| 10% |
9.8% |
13,724 |
13,475 |
| Active Idle |
|
0 |
0 |
JVM 'localhost.019' Scores:
| Target Load |
Actual Load |
ssj_ops |
| Target |
Actual |
| Calibration 1 |
|
|
139,700 |
| Calibration 2 |
|
|
136,853 |
| Calibration 3 |
|
|
136,560 |
| ssj_ops@calibrated=136,706 |
| 100% |
99.8% |
136,706 |
136,433 |
| 90% |
89.2% |
123,036 |
121,874 |
| 80% |
80.6% |
109,365 |
110,130 |
| 70% |
70.7% |
95,695 |
96,644 |
| 60% |
60.7% |
82,024 |
82,984 |
| 50% |
50.2% |
68,353 |
68,675 |
| 40% |
40.4% |
54,683 |
55,290 |
| 30% |
30.1% |
41,012 |
41,135 |
| 20% |
20.3% |
27,341 |
27,700 |
| 10% |
9.8% |
13,671 |
13,417 |
| Active Idle |
|
0 |
0 |
JVM 'localhost.020' Scores:
| Target Load |
Actual Load |
ssj_ops |
| Target |
Actual |
| Calibration 1 |
|
|
139,000 |
| Calibration 2 |
|
|
136,653 |
| Calibration 3 |
|
|
136,579 |
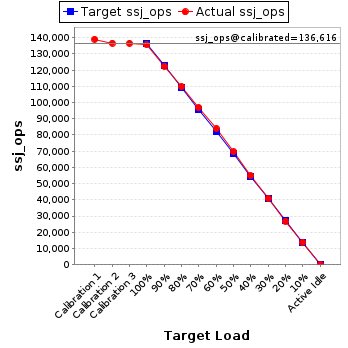
| ssj_ops@calibrated=136,616 |
| 100% |
99.3% |
136,616 |
135,678 |
| 90% |
89.6% |
122,955 |
122,476 |
| 80% |
80.4% |
109,293 |
109,879 |
| 70% |
70.9% |
95,631 |
96,881 |
| 60% |
61.4% |
81,970 |
83,894 |
| 50% |
50.9% |
68,308 |
69,584 |
| 40% |
40.1% |
54,646 |
54,819 |
| 30% |
30.0% |
40,985 |
40,979 |
| 20% |
19.7% |
27,323 |
26,903 |
| 10% |
10.1% |
13,662 |
13,850 |
| Active Idle |
|
0 |
0 |
JVM 'localhost.021' Scores:
| Target Load |
Actual Load |
ssj_ops |
| Target |
Actual |
| Calibration 1 |
|
|
137,767 |
| Calibration 2 |
|
|
135,114 |
| Calibration 3 |
|
|
134,913 |
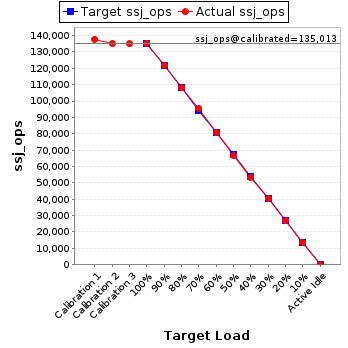
| ssj_ops@calibrated=135,013 |
| 100% |
100.2% |
135,013 |
135,291 |
| 90% |
90.2% |
121,512 |
121,832 |
| 80% |
80.0% |
108,011 |
107,986 |
| 70% |
70.7% |
94,509 |
95,435 |
| 60% |
59.7% |
81,008 |
80,549 |
| 50% |
49.5% |
67,507 |
66,769 |
| 40% |
39.7% |
54,005 |
53,537 |
| 30% |
29.9% |
40,504 |
40,314 |
| 20% |
20.0% |
27,003 |
26,936 |
| 10% |
9.9% |
13,501 |
13,421 |
| Active Idle |
|
0 |
0 |
JVM 'localhost.022' Scores:
| Target Load |
Actual Load |
ssj_ops |
| Target |
Actual |
| Calibration 1 |
|
|
138,339 |
| Calibration 2 |
|
|
135,839 |
| Calibration 3 |
|
|
135,711 |
| ssj_ops@calibrated=135,775 |
| 100% |
100.0% |
135,775 |
135,791 |
| 90% |
91.1% |
122,198 |
123,759 |
| 80% |
80.4% |
108,620 |
109,140 |
| 70% |
70.7% |
95,043 |
96,044 |
| 60% |
60.1% |
81,465 |
81,609 |
| 50% |
50.1% |
67,888 |
67,960 |
| 40% |
40.1% |
54,310 |
54,460 |
| 30% |
30.0% |
40,733 |
40,796 |
| 20% |
20.1% |
27,155 |
27,271 |
| 10% |
10.3% |
13,578 |
13,958 |
| Active Idle |
|
0 |
0 |
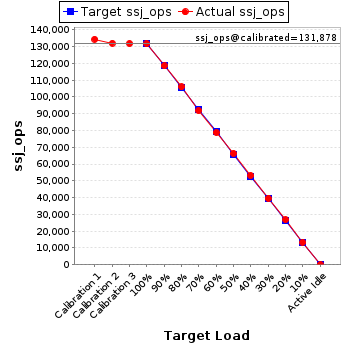
JVM 'localhost.023' Scores:
| Target Load |
Actual Load |
ssj_ops |
| Target |
Actual |
| Calibration 1 |
|
|
134,366 |
| Calibration 2 |
|
|
132,006 |
| Calibration 3 |
|
|
131,751 |
| ssj_ops@calibrated=131,878 |
| 100% |
99.8% |
131,878 |
131,654 |
| 90% |
89.9% |
118,690 |
118,525 |
| 80% |
80.3% |
105,503 |
105,932 |
| 70% |
69.6% |
92,315 |
91,783 |
| 60% |
59.7% |
79,127 |
78,737 |
| 50% |
50.3% |
65,939 |
66,314 |
| 40% |
40.3% |
52,751 |
53,187 |
| 30% |
30.0% |
39,563 |
39,537 |
| 20% |
20.3% |
26,376 |
26,829 |
| 10% |
10.2% |
13,188 |
13,412 |
| Active Idle |
|
0 |
0 |
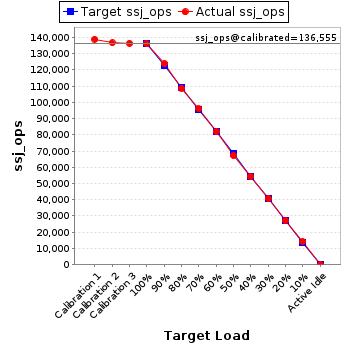
JVM 'localhost.024' Scores:
| Target Load |
Actual Load |
ssj_ops |
| Target |
Actual |
| Calibration 1 |
|
|
138,915 |
| Calibration 2 |
|
|
136,656 |
| Calibration 3 |
|
|
136,454 |
| ssj_ops@calibrated=136,555 |
| 100% |
99.7% |
136,555 |
136,132 |
| 90% |
90.8% |
122,899 |
123,971 |
| 80% |
79.6% |
109,244 |
108,702 |
| 70% |
70.3% |
95,588 |
96,050 |
| 60% |
60.2% |
81,933 |
82,143 |
| 50% |
49.2% |
68,277 |
67,210 |
| 40% |
39.7% |
54,622 |
54,270 |
| 30% |
29.8% |
40,966 |
40,721 |
| 20% |
19.8% |
27,311 |
27,017 |
| 10% |
10.4% |
13,655 |
14,172 |
| Active Idle |
|
0 |
0 |
JVM 'localhost.025' Scores:
| Target Load |
Actual Load |
ssj_ops |
| Target |
Actual |
| Calibration 1 |
|
|
139,499 |
| Calibration 2 |
|
|
137,046 |
| Calibration 3 |
|
|
136,678 |
| ssj_ops@calibrated=136,862 |
| 100% |
99.1% |
136,862 |
135,562 |
| 90% |
89.2% |
123,176 |
122,119 |
| 80% |
80.0% |
109,490 |
109,468 |
| 70% |
70.9% |
95,803 |
97,054 |
| 60% |
59.6% |
82,117 |
81,621 |
| 50% |
50.7% |
68,431 |
69,443 |
| 40% |
39.7% |
54,745 |
54,302 |
| 30% |
29.9% |
41,059 |
40,895 |
| 20% |
19.9% |
27,372 |
27,234 |
| 10% |
10.3% |
13,686 |
14,066 |
| Active Idle |
|
0 |
0 |
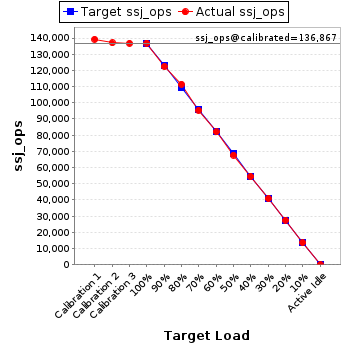
JVM 'localhost.026' Scores:
| Target Load |
Actual Load |
ssj_ops |
| Target |
Actual |
| Calibration 1 |
|
|
139,240 |
| Calibration 2 |
|
|
136,957 |
| Calibration 3 |
|
|
136,777 |
| ssj_ops@calibrated=136,867 |
| 100% |
100.0% |
136,867 |
136,879 |
| 90% |
89.4% |
123,180 |
122,376 |
| 80% |
81.5% |
109,494 |
111,509 |
| 70% |
69.7% |
95,807 |
95,367 |
| 60% |
59.9% |
82,120 |
81,987 |
| 50% |
49.5% |
68,434 |
67,735 |
| 40% |
39.8% |
54,747 |
54,431 |
| 30% |
29.9% |
41,060 |
40,906 |
| 20% |
20.1% |
27,373 |
27,568 |
| 10% |
10.0% |
13,687 |
13,630 |
| Active Idle |
|
0 |
0 |
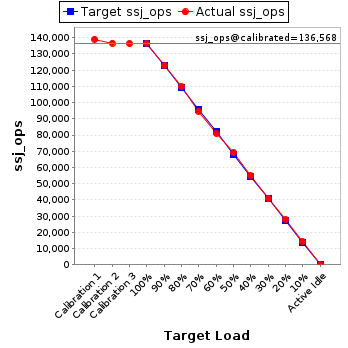
JVM 'localhost.027' Scores:
| Target Load |
Actual Load |
ssj_ops |
| Target |
Actual |
| Calibration 1 |
|
|
139,105 |
| Calibration 2 |
|
|
136,738 |
| Calibration 3 |
|
|
136,397 |
| ssj_ops@calibrated=136,568 |
| 100% |
100.0% |
136,568 |
136,587 |
| 90% |
90.1% |
122,911 |
123,027 |
| 80% |
80.4% |
109,254 |
109,781 |
| 70% |
69.4% |
95,597 |
94,731 |
| 60% |
59.4% |
81,941 |
81,071 |
| 50% |
50.6% |
68,284 |
69,147 |
| 40% |
40.2% |
54,627 |
54,833 |
| 30% |
30.0% |
40,970 |
40,908 |
| 20% |
20.4% |
27,314 |
27,903 |
| 10% |
10.3% |
13,657 |
14,058 |
| Active Idle |
|
0 |
0 |
JVM 'localhost.028' Scores:
| Target Load |
Actual Load |
ssj_ops |
| Target |
Actual |
| Calibration 1 |
|
|
140,348 |
| Calibration 2 |
|
|
137,861 |
| Calibration 3 |
|
|
137,832 |
| ssj_ops@calibrated=137,847 |
| 100% |
99.9% |
137,847 |
137,667 |
| 90% |
90.0% |
124,062 |
124,085 |
| 80% |
80.5% |
110,277 |
110,932 |
| 70% |
70.6% |
96,493 |
97,318 |
| 60% |
59.8% |
82,708 |
82,429 |
| 50% |
50.3% |
68,923 |
69,329 |
| 40% |
39.8% |
55,139 |
54,816 |
| 30% |
29.7% |
41,354 |
40,877 |
| 20% |
19.9% |
27,569 |
27,392 |
| 10% |
9.9% |
13,785 |
13,621 |
| Active Idle |
|
0 |
0 |
JVM 'localhost.029' Scores:
| Target Load |
Actual Load |
ssj_ops |
| Target |
Actual |
| Calibration 1 |
|
|
138,436 |
| Calibration 2 |
|
|
135,845 |
| Calibration 3 |
|
|
135,600 |
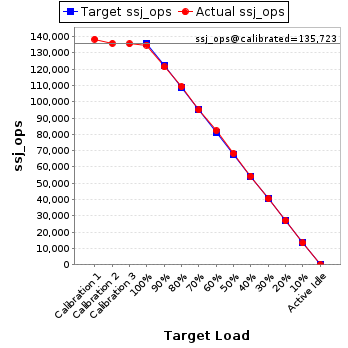
| ssj_ops@calibrated=135,723 |
| 100% |
99.4% |
135,723 |
134,881 |
| 90% |
89.4% |
122,150 |
121,395 |
| 80% |
80.5% |
108,578 |
109,313 |
| 70% |
70.0% |
95,006 |
95,016 |
| 60% |
60.6% |
81,434 |
82,258 |
| 50% |
50.3% |
67,861 |
68,290 |
| 40% |
40.1% |
54,289 |
54,379 |
| 30% |
29.9% |
40,717 |
40,538 |
| 20% |
19.9% |
27,145 |
27,021 |
| 10% |
9.8% |
13,572 |
13,362 |
| Active Idle |
|
0 |
0 |
JVM 'localhost.030' Scores:
| Target Load |
Actual Load |
ssj_ops |
| Target |
Actual |
| Calibration 1 |
|
|
138,190 |
| Calibration 2 |
|
|
136,662 |
| Calibration 3 |
|
|
136,569 |
| ssj_ops@calibrated=136,615 |
| 100% |
99.9% |
136,615 |
136,430 |
| 90% |
90.2% |
122,954 |
123,236 |
| 80% |
80.2% |
109,292 |
109,609 |
| 70% |
70.1% |
95,631 |
95,730 |
| 60% |
59.7% |
81,969 |
81,557 |
| 50% |
49.4% |
68,308 |
67,534 |
| 40% |
40.2% |
54,646 |
54,860 |
| 30% |
30.3% |
40,985 |
41,362 |
| 20% |
20.2% |
27,323 |
27,645 |
| 10% |
9.9% |
13,662 |
13,546 |
| Active Idle |
|
0 |
0 |
JVM 'localhost.031' Scores:
| Target Load |
Actual Load |
ssj_ops |
| Target |
Actual |
| Calibration 1 |
|
|
138,449 |
| Calibration 2 |
|
|
135,843 |
| Calibration 3 |
|
|
135,622 |
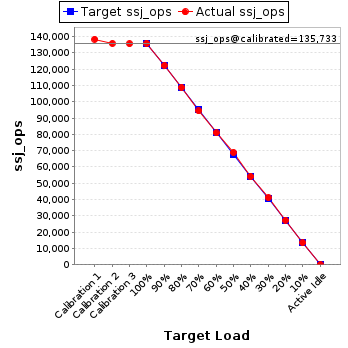
| ssj_ops@calibrated=135,733 |
| 100% |
100.1% |
135,733 |
135,906 |
| 90% |
90.1% |
122,159 |
122,333 |
| 80% |
80.2% |
108,586 |
108,857 |
| 70% |
69.5% |
95,013 |
94,381 |
| 60% |
59.6% |
81,440 |
80,932 |
| 50% |
50.8% |
67,866 |
68,941 |
| 40% |
39.9% |
54,293 |
54,156 |
| 30% |
30.3% |
40,720 |
41,118 |
| 20% |
20.2% |
27,147 |
27,384 |
| 10% |
9.9% |
13,573 |
13,472 |
| Active Idle |
|
0 |
0 |
JVM 'localhost.032' Scores:
| Target Load |
Actual Load |
ssj_ops |
| Target |
Actual |
| Calibration 1 |
|
|
138,861 |
| Calibration 2 |
|
|
135,960 |
| Calibration 3 |
|
|
136,052 |
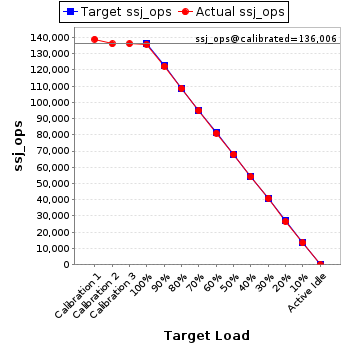
| ssj_ops@calibrated=136,006 |
| 100% |
99.8% |
136,006 |
135,685 |
| 90% |
89.8% |
122,405 |
122,178 |
| 80% |
79.8% |
108,805 |
108,493 |
| 70% |
69.7% |
95,204 |
94,828 |
| 60% |
59.5% |
81,603 |
80,982 |
| 50% |
49.9% |
68,003 |
67,923 |
| 40% |
39.7% |
54,402 |
54,049 |
| 30% |
30.1% |
40,802 |
40,908 |
| 20% |
19.5% |
27,201 |
26,529 |
| 10% |
9.9% |
13,601 |
13,474 |
| Active Idle |
|
0 |
0 |