SPECpower_ssj2008
Host 'perf' Performance Report
Copyright © 2007-2025 Standard Performance Evaluation Corporation
| Lenovo Global Technology ThinkEdge SE100 | ssj_ops@100% = 1,031,011 ssj_ops@100% per JVM = 64,438 |
||||
| Test Sponsor: | Lenovo Global Technology | SPEC License #: | 9017 | Test Method: | Single Node |
| Tested By: | Lenovo Global Technology | Test Location: | Beijing, China | Test Date: | Jun 3, 2025 |
| Hardware Availability: | May-2025 | Software Availability: | Feb-2025 | Publication: | Jun 23, 2025 |
| System Source: | Single Supplier | System Designation: | Server | Power Provisioning: | Line-powered |
| Target Load | Actual Load | ssj_ops | |
|---|---|---|---|
| Target | Actual | ||
| Calibration 1 | 864,734 | ||
| Calibration 2 | 1,014,568 | ||
| Calibration 3 | 1,045,857 | ||
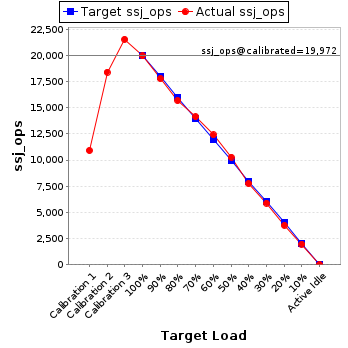
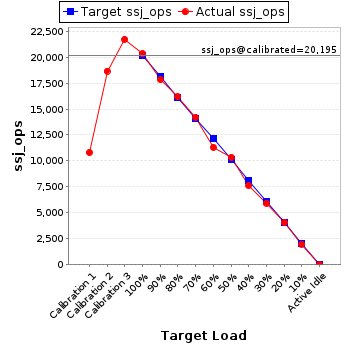
| ssj_ops@calibrated=1,030,213 | |||
| 100% | 100.1% | 1,030,213 | 1,031,011 |
| 90% | 89.9% | 927,191 | 925,957 |
| 80% | 80.0% | 824,170 | 823,964 |
| 70% | 70.0% | 721,149 | 720,906 |
| 60% | 59.8% | 618,128 | 615,555 |
| 50% | 50.1% | 515,106 | 516,325 |
| 40% | 39.9% | 412,085 | 411,437 |
| 30% | 30.2% | 309,064 | 310,930 |
| 20% | 20.0% | 206,043 | 205,792 |
| 10% | 9.9% | 103,021 | 102,418 |
| Active Idle | 0 | 0 | |
| Set Identifier: | sut |
| Set Description: | System Under Test |
| # of Identical Nodes: | 1 |
| Comment: | 'SUT' |
| Hardware | |
|---|---|
| Hardware Vendor: | Lenovo Global Technology |
| Model: | ThinkEdge SE100 |
| Form Factor: | 1U |
| CPU Name: | Intel Core Ultra 7 255H |
| CPU Characteristics: | 16 Core, 2.0GHz, 24MB L3 Cache |
| CPU Frequency (MHz): | 2000 |
| CPU(s) Enabled: | 16 cores, 1 chip, 16 cores/chip |
| Hardware Threads: | 16 (1 / core) |
| CPU(s) Orderable: | 1 chip |
| Primary Cache: | 64 KB I + 48 KB D on chip per core |
| Secondary Cache: | 3 MB I+D on chip per core |
| Tertiary Cache: | 24 MB I+D on chip per chip |
| Other Cache: | None |
| Memory Amount (GB): | 16 |
| # and size of DIMM: | 2 x 8192 MB |
| Memory Details: | 8GB 1Rx16 PC5-6400B; slots 1 and 2 populated |
| Power Supply Quantity and Rating (W): | 1 x 140 |
| Power Supply Details: | Lenovo P/N:4X27A92699 |
| Disk Drive: | 1 x 240GB M.2 SSD P/N:4XB7A89422 |
| Disk Controller: | Integrated SATA controller |
| # and type of Network Interface Cards (NICs) Installed: | 1 x 1GbE RJ45 |
| NICs Enabled in Firmware / OS / Connected: | 4/4/1 |
| Network Speed (Mbit): | 1000 |
| Keyboard: | None |
| Mouse: | None |
| Monitor: | None |
| Optical Drives: | No |
| Other Hardware: | None |
| Software | |
|---|---|
| Power Management: | Enabled (see SUT Notes) |
| Operating System (OS): | Ubuntu 24.04.2 LTS 64-bit |
| OS Version: | Linux 6.8.0-60-generic |
| Filesystem: | ext4 |
| JVM Vendor: | Oracle Corporation |
| JVM Version: | Java HotSpot(TM) 64-Bit Server VM (build 17.0.10+11-LTS-240, mixed mode, sharing), version 17.0.10 |
| JVM Command-line Options: | -server -Xmn450m -Xms512m -Xmx512m -XX:ParallelGCThreads=2 -XX:+UseLargePages -XX:InlineSmallCode=1500 -XX:AutoBoxCacheMax=20000 -XX:+UseParallelGC -XX:FreqInlineSize=2500 -XX:CompileThresholdScaling=210 |
| JVM Affinity: | for each physicalCore { numactl -C physicalCoreId } |
| JVM Instances: | 16 |
| JVM Initial Heap (MB): | 512 |
| JVM Maximum Heap (MB): | 512 |
| JVM Address Bits: | 64 |
| Boot Firmware Version: | DZE104U |
| Management Firmware Version: | DZX310C |
| Workload Version: | SSJ 1.2.10 |
| Director Location: | Controller |
| Other Software: | None |
| JVM Instance | ssj_ops@100% |
|---|---|
| perf.001 | 92,694 |
| perf.002 | 93,385 |
| perf.003 | 92,368 |
| perf.004 | 93,009 |
| perf.005 | 92,612 |
| perf.006 | 91,644 |
| perf.007 | 54,343 |
| perf.008 | 54,378 |
| perf.009 | 54,017 |
| perf.010 | 54,843 |
| perf.011 | 54,928 |
| perf.012 | 54,405 |
| perf.013 | 53,910 |
| perf.014 | 54,197 |
| perf.015 | 20,326 |
| perf.016 | 19,951 |
| ssj_ops@100% | 1,031,011 |
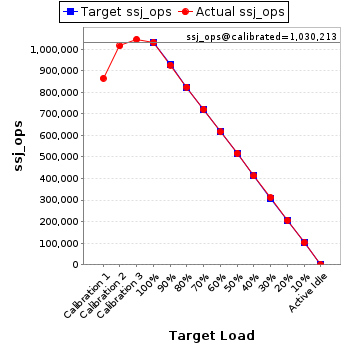
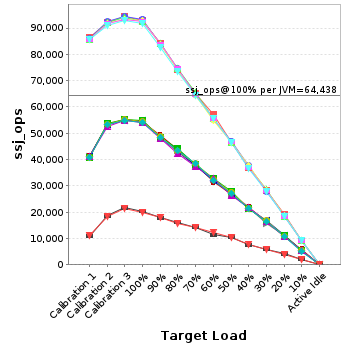
| ssj_ops@100% per JVM | 64,438 |
| Target Load | Actual Load | ssj_ops | |
|---|---|---|---|
| Target | Actual | ||
| Calibration 1 | 86,484 | ||
| Calibration 2 | 92,283 | ||
| Calibration 3 | 94,410 | ||
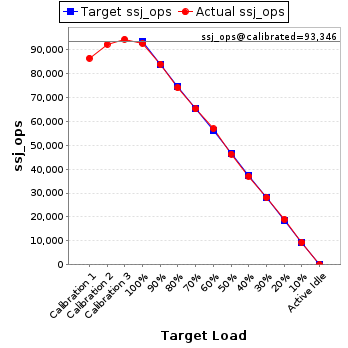
| ssj_ops@calibrated=93,346 | |||
| 100% | 99.3% | 93,346 | 92,694 |
| 90% | 90.0% | 84,012 | 83,985 |
| 80% | 79.4% | 74,677 | 74,115 |
| 70% | 69.9% | 65,342 | 65,208 |
| 60% | 61.0% | 56,008 | 56,921 |
| 50% | 49.6% | 46,673 | 46,334 |
| 40% | 39.7% | 37,339 | 37,037 |
| 30% | 30.1% | 28,004 | 28,054 |
| 20% | 20.4% | 18,669 | 19,027 |
| 10% | 10.0% | 9,335 | 9,371 |
| Active Idle | 0 | 0 | |
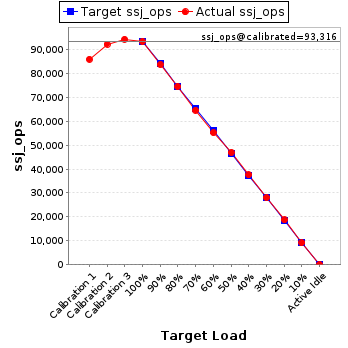
| Target Load | Actual Load | ssj_ops | |
|---|---|---|---|
| Target | Actual | ||
| Calibration 1 | 85,976 | ||
| Calibration 2 | 92,305 | ||
| Calibration 3 | 94,327 | ||
| ssj_ops@calibrated=93,316 | |||
| 100% | 100.1% | 93,316 | 93,385 |
| 90% | 89.7% | 83,984 | 83,662 |
| 80% | 79.9% | 74,653 | 74,518 |
| 70% | 69.2% | 65,321 | 64,598 |
| 60% | 59.1% | 55,989 | 55,194 |
| 50% | 50.3% | 46,658 | 46,975 |
| 40% | 40.3% | 37,326 | 37,583 |
| 30% | 30.0% | 27,995 | 27,967 |
| 20% | 20.1% | 18,663 | 18,717 |
| 10% | 9.8% | 9,332 | 9,175 |
| Active Idle | 0 | 0 | |
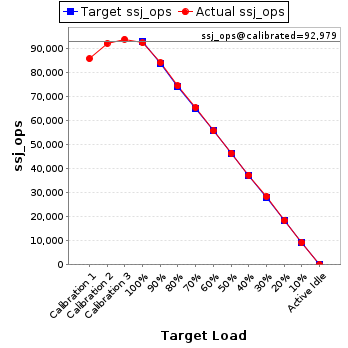
| Target Load | Actual Load | ssj_ops | |
|---|---|---|---|
| Target | Actual | ||
| Calibration 1 | 85,754 | ||
| Calibration 2 | 92,087 | ||
| Calibration 3 | 93,871 | ||
| ssj_ops@calibrated=92,979 | |||
| 100% | 99.3% | 92,979 | 92,368 |
| 90% | 90.5% | 83,681 | 84,109 |
| 80% | 80.1% | 74,383 | 74,455 |
| 70% | 70.4% | 65,085 | 65,425 |
| 60% | 59.9% | 55,787 | 55,666 |
| 50% | 49.9% | 46,490 | 46,374 |
| 40% | 40.1% | 37,192 | 37,289 |
| 30% | 30.5% | 27,894 | 28,396 |
| 20% | 19.8% | 18,596 | 18,453 |
| 10% | 9.9% | 9,298 | 9,242 |
| Active Idle | 0 | 0 | |
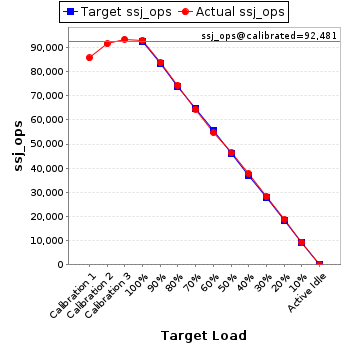
| Target Load | Actual Load | ssj_ops | |
|---|---|---|---|
| Target | Actual | ||
| Calibration 1 | 85,651 | ||
| Calibration 2 | 91,545 | ||
| Calibration 3 | 93,418 | ||
| ssj_ops@calibrated=92,481 | |||
| 100% | 100.6% | 92,481 | 93,009 |
| 90% | 90.5% | 83,233 | 83,719 |
| 80% | 80.4% | 73,985 | 74,314 |
| 70% | 69.7% | 64,737 | 64,479 |
| 60% | 59.2% | 55,489 | 54,728 |
| 50% | 50.0% | 46,241 | 46,276 |
| 40% | 40.7% | 36,993 | 37,629 |
| 30% | 30.5% | 27,744 | 28,222 |
| 20% | 20.2% | 18,496 | 18,679 |
| 10% | 10.1% | 9,248 | 9,317 |
| Active Idle | 0 | 0 | |
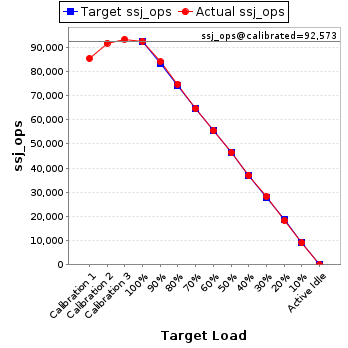
| Target Load | Actual Load | ssj_ops | |
|---|---|---|---|
| Target | Actual | ||
| Calibration 1 | 85,458 | ||
| Calibration 2 | 91,771 | ||
| Calibration 3 | 93,375 | ||
| ssj_ops@calibrated=92,573 | |||
| 100% | 100.0% | 92,573 | 92,612 |
| 90% | 90.8% | 83,316 | 84,051 |
| 80% | 80.7% | 74,058 | 74,746 |
| 70% | 69.8% | 64,801 | 64,611 |
| 60% | 59.9% | 55,544 | 55,491 |
| 50% | 50.2% | 46,287 | 46,515 |
| 40% | 39.9% | 37,029 | 36,937 |
| 30% | 30.5% | 27,772 | 28,192 |
| 20% | 19.7% | 18,515 | 18,221 |
| 10% | 9.8% | 9,257 | 9,037 |
| Active Idle | 0 | 0 | |
| Target Load | Actual Load | ssj_ops | |
|---|---|---|---|
| Target | Actual | ||
| Calibration 1 | 85,754 | ||
| Calibration 2 | 91,090 | ||
| Calibration 3 | 92,878 | ||
| ssj_ops@calibrated=91,984 | |||
| 100% | 99.6% | 91,984 | 91,644 |
| 90% | 89.7% | 82,786 | 82,476 |
| 80% | 79.8% | 73,587 | 73,412 |
| 70% | 70.0% | 64,389 | 64,352 |
| 60% | 60.4% | 55,191 | 55,537 |
| 50% | 50.4% | 45,992 | 46,355 |
| 40% | 39.8% | 36,794 | 36,609 |
| 30% | 30.1% | 27,595 | 27,642 |
| 20% | 20.0% | 18,397 | 18,374 |
| 10% | 10.1% | 9,198 | 9,329 |
| Active Idle | 0 | 0 | |

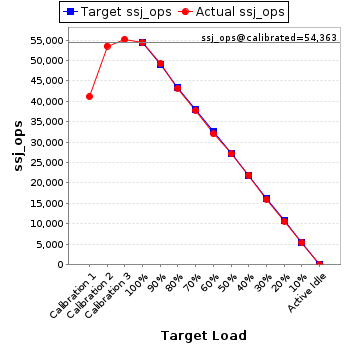
| Target Load | Actual Load | ssj_ops | |
|---|---|---|---|
| Target | Actual | ||
| Calibration 1 | 41,160 | ||
| Calibration 2 | 53,528 | ||
| Calibration 3 | 55,197 | ||
| ssj_ops@calibrated=54,363 | |||
| 100% | 100.0% | 54,363 | 54,343 |
| 90% | 90.5% | 48,926 | 49,216 |
| 80% | 79.5% | 43,490 | 43,244 |
| 70% | 69.5% | 38,054 | 37,787 |
| 60% | 58.9% | 32,618 | 32,008 |
| 50% | 49.8% | 27,181 | 27,099 |
| 40% | 40.4% | 21,745 | 21,951 |
| 30% | 29.6% | 16,309 | 16,075 |
| 20% | 19.5% | 10,873 | 10,625 |
| 10% | 9.8% | 5,436 | 5,325 |
| Active Idle | 0 | 0 | |
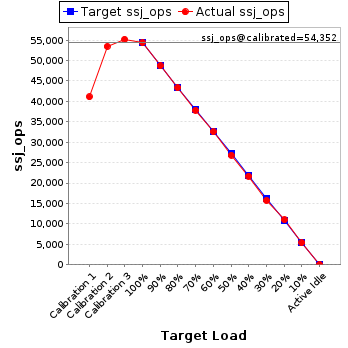
| Target Load | Actual Load | ssj_ops | |
|---|---|---|---|
| Target | Actual | ||
| Calibration 1 | 41,097 | ||
| Calibration 2 | 53,475 | ||
| Calibration 3 | 55,229 | ||
| ssj_ops@calibrated=54,352 | |||
| 100% | 100.0% | 54,352 | 54,378 |
| 90% | 89.6% | 48,917 | 48,693 |
| 80% | 79.8% | 43,482 | 43,351 |
| 70% | 69.6% | 38,046 | 37,823 |
| 60% | 59.9% | 32,611 | 32,531 |
| 50% | 49.3% | 27,176 | 26,821 |
| 40% | 39.9% | 21,741 | 21,675 |
| 30% | 28.9% | 16,306 | 15,711 |
| 20% | 20.3% | 10,870 | 11,008 |
| 10% | 9.9% | 5,435 | 5,375 |
| Active Idle | 0 | 0 | |
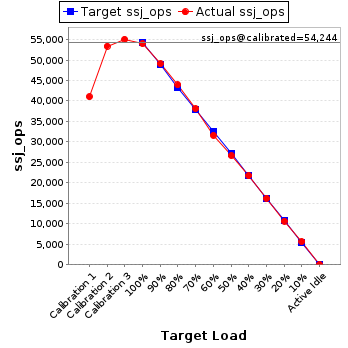
| Target Load | Actual Load | ssj_ops | |
|---|---|---|---|
| Target | Actual | ||
| Calibration 1 | 41,017 | ||
| Calibration 2 | 53,405 | ||
| Calibration 3 | 55,083 | ||
| ssj_ops@calibrated=54,244 | |||
| 100% | 99.6% | 54,244 | 54,017 |
| 90% | 90.5% | 48,819 | 49,082 |
| 80% | 81.0% | 43,395 | 43,930 |
| 70% | 70.3% | 37,971 | 38,148 |
| 60% | 58.3% | 32,546 | 31,603 |
| 50% | 49.1% | 27,122 | 26,643 |
| 40% | 40.1% | 21,698 | 21,729 |
| 30% | 29.9% | 16,273 | 16,237 |
| 20% | 19.6% | 10,849 | 10,646 |
| 10% | 10.4% | 5,424 | 5,633 |
| Active Idle | 0 | 0 | |
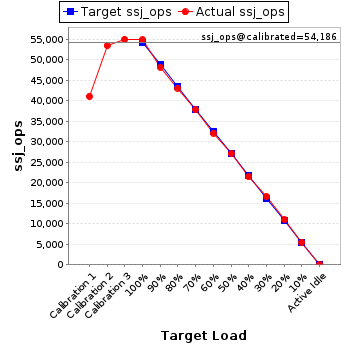
| Target Load | Actual Load | ssj_ops | |
|---|---|---|---|
| Target | Actual | ||
| Calibration 1 | 41,040 | ||
| Calibration 2 | 53,389 | ||
| Calibration 3 | 54,984 | ||
| ssj_ops@calibrated=54,186 | |||
| 100% | 101.2% | 54,186 | 54,843 |
| 90% | 89.0% | 48,768 | 48,209 |
| 80% | 79.5% | 43,349 | 43,071 |
| 70% | 69.8% | 37,931 | 37,812 |
| 60% | 59.2% | 32,512 | 32,096 |
| 50% | 50.0% | 27,093 | 27,081 |
| 40% | 39.6% | 21,675 | 21,439 |
| 30% | 30.7% | 16,256 | 16,623 |
| 20% | 20.2% | 10,837 | 10,942 |
| 10% | 10.1% | 5,419 | 5,458 |
| Active Idle | 0 | 0 | |
| Target Load | Actual Load | ssj_ops | |
|---|---|---|---|
| Target | Actual | ||
| Calibration 1 | 40,866 | ||
| Calibration 2 | 53,565 | ||
| Calibration 3 | 55,200 | ||
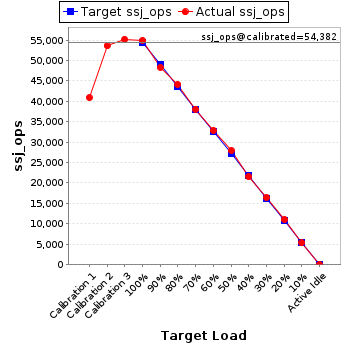
| ssj_ops@calibrated=54,382 | |||
| 100% | 101.0% | 54,382 | 54,928 |
| 90% | 88.8% | 48,944 | 48,280 |
| 80% | 81.2% | 43,506 | 44,139 |
| 70% | 70.0% | 38,067 | 38,094 |
| 60% | 60.4% | 32,629 | 32,868 |
| 50% | 51.5% | 27,191 | 27,987 |
| 40% | 39.6% | 21,753 | 21,534 |
| 30% | 30.2% | 16,315 | 16,433 |
| 20% | 20.4% | 10,876 | 11,083 |
| 10% | 9.8% | 5,438 | 5,342 |
| Active Idle | 0 | 0 | |
| Target Load | Actual Load | ssj_ops | |
|---|---|---|---|
| Target | Actual | ||
| Calibration 1 | 40,721 | ||
| Calibration 2 | 53,406 | ||
| Calibration 3 | 55,033 | ||
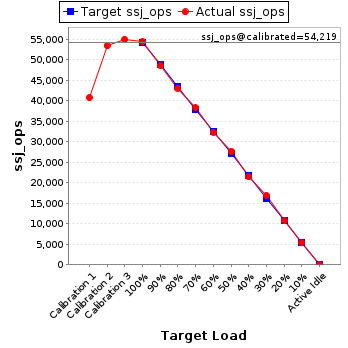
| ssj_ops@calibrated=54,219 | |||
| 100% | 100.3% | 54,219 | 54,405 |
| 90% | 89.7% | 48,797 | 48,618 |
| 80% | 79.5% | 43,375 | 43,100 |
| 70% | 70.6% | 37,954 | 38,293 |
| 60% | 59.7% | 32,532 | 32,353 |
| 50% | 51.0% | 27,110 | 27,629 |
| 40% | 39.5% | 21,688 | 21,424 |
| 30% | 31.2% | 16,266 | 16,925 |
| 20% | 19.8% | 10,844 | 10,750 |
| 10% | 9.8% | 5,422 | 5,339 |
| Active Idle | 0 | 0 | |
| Target Load | Actual Load | ssj_ops | |
|---|---|---|---|
| Target | Actual | ||
| Calibration 1 | 41,185 | ||
| Calibration 2 | 52,372 | ||
| Calibration 3 | 54,924 | ||
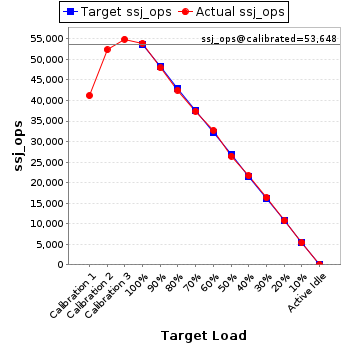
| ssj_ops@calibrated=53,648 | |||
| 100% | 100.5% | 53,648 | 53,910 |
| 90% | 89.4% | 48,283 | 47,960 |
| 80% | 79.2% | 42,918 | 42,462 |
| 70% | 69.7% | 37,553 | 37,372 |
| 60% | 61.0% | 32,189 | 32,717 |
| 50% | 49.2% | 26,824 | 26,421 |
| 40% | 40.4% | 21,459 | 21,671 |
| 30% | 30.4% | 16,094 | 16,332 |
| 20% | 20.0% | 10,730 | 10,713 |
| 10% | 10.0% | 5,365 | 5,367 |
| Active Idle | 0 | 0 | |
| Target Load | Actual Load | ssj_ops | |
|---|---|---|---|
| Target | Actual | ||
| Calibration 1 | 40,851 | ||
| Calibration 2 | 53,283 | ||
| Calibration 3 | 54,659 | ||
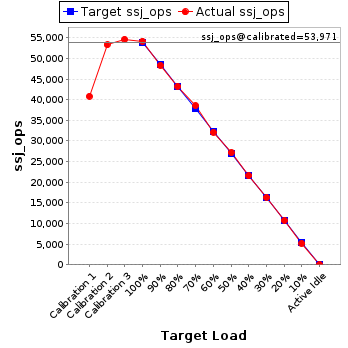
| ssj_ops@calibrated=53,971 | |||
| 100% | 100.4% | 53,971 | 54,197 |
| 90% | 89.5% | 48,574 | 48,279 |
| 80% | 80.1% | 43,177 | 43,235 |
| 70% | 71.4% | 37,780 | 38,554 |
| 60% | 59.5% | 32,383 | 32,122 |
| 50% | 50.4% | 26,986 | 27,187 |
| 40% | 39.9% | 21,589 | 21,550 |
| 30% | 30.2% | 16,191 | 16,301 |
| 20% | 19.9% | 10,794 | 10,725 |
| 10% | 9.5% | 5,397 | 5,146 |
| Active Idle | 0 | 0 | |
| Target Load | Actual Load | ssj_ops | |
|---|---|---|---|
| Target | Actual | ||
| Calibration 1 | 10,801 | ||
| Calibration 2 | 18,662 | ||
| Calibration 3 | 21,728 | ||
| ssj_ops@calibrated=20,195 | |||
| 100% | 100.7% | 20,195 | 20,326 |
| 90% | 88.3% | 18,175 | 17,842 |
| 80% | 80.2% | 16,156 | 16,191 |
| 70% | 70.4% | 14,136 | 14,214 |
| 60% | 56.1% | 12,117 | 11,321 |
| 50% | 51.2% | 10,097 | 10,346 |
| 40% | 37.8% | 8,078 | 7,633 |
| 30% | 29.4% | 6,058 | 5,929 |
| 20% | 20.1% | 4,039 | 4,062 |
| 10% | 9.8% | 2,019 | 1,987 |
| Active Idle | 0 | 0 | |
| Target Load | Actual Load | ssj_ops | |
|---|---|---|---|
| Target | Actual | ||
| Calibration 1 | 10,917 | ||
| Calibration 2 | 18,401 | ||
| Calibration 3 | 21,544 | ||
| ssj_ops@calibrated=19,972 | |||
| 100% | 99.9% | 19,972 | 19,951 |
| 90% | 89.0% | 17,975 | 17,774 |
| 80% | 78.5% | 15,978 | 15,681 |
| 70% | 70.8% | 13,981 | 14,134 |
| 60% | 62.1% | 11,983 | 12,399 |
| 50% | 51.5% | 9,986 | 10,281 |
| 40% | 38.8% | 7,989 | 7,746 |
| 30% | 29.5% | 5,992 | 5,891 |
| 20% | 18.9% | 3,994 | 3,767 |
| 10% | 9.9% | 1,997 | 1,975 |
| Active Idle | 0 | 0 | |