SPECpower_ssj2008
Host 'perf-1' Performance Report
Copyright © 2007-2025 Standard Performance Evaluation Corporation
| Lenovo Global Technology ThinkEdge SE100 | ssj_ops@100% = 1,024,560 ssj_ops@100% per JVM = 64,035 |
||||
| Test Sponsor: | Lenovo Global Technology | SPEC License #: | 9017 | Test Method: | Multi Node |
| Tested By: | Lenovo Global Technology | Test Location: | Beijing, China | Test Date: | Jun 12, 2025 |
| Hardware Availability: | May-2025 | Software Availability: | Feb-2025 | Publication: | Jul 1, 2025 |
| System Source: | Single Supplier | System Designation: | Server | Power Provisioning: | Line-powered |
| Target Load | Actual Load | ssj_ops | |
|---|---|---|---|
| Target | Actual | ||
| Calibration 1 | 862,118 | ||
| Calibration 2 | 1,012,077 | ||
| Calibration 3 | 1,040,757 | ||
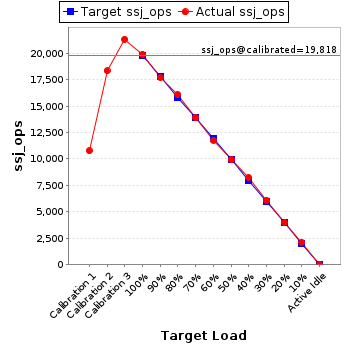
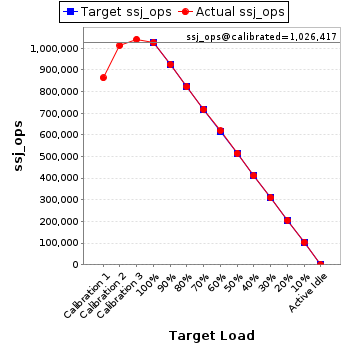
| ssj_ops@calibrated=1,026,417 | |||
| 100% | 99.8% | 1,026,417 | 1,024,560 |
| 90% | 90.0% | 923,776 | 923,875 |
| 80% | 80.0% | 821,134 | 820,833 |
| 70% | 69.8% | 718,492 | 716,908 |
| 60% | 60.2% | 615,850 | 617,682 |
| 50% | 50.0% | 513,209 | 513,587 |
| 40% | 40.0% | 410,567 | 410,142 |
| 30% | 30.1% | 307,925 | 308,950 |
| 20% | 20.0% | 205,283 | 205,051 |
| 10% | 10.1% | 102,642 | 103,801 |
| Active Idle | 0 | 0 | |
| Set Identifier: | sut |
| Set Description: | System Under Test |
| # of Identical Nodes: | 2 |
| Comment: | 'SUT' |
| Hardware | |
|---|---|
| Hardware Vendor: | Lenovo Global Technology |
| Model: | ThinkEdge SE100 |
| Form Factor: | 1U |
| CPU Name: | Intel Core Ultra 7 255H |
| CPU Characteristics: | 16 Core, 2.0GHz, 24MB L3 Cache |
| CPU Frequency (MHz): | 2000 |
| CPU(s) Enabled: | 16 cores, 1 chip, 16 cores/chip |
| Hardware Threads: | 16 (1 / core) |
| CPU(s) Orderable: | 1 chip |
| Primary Cache: | 64 KB I + 48 KB D on chip per core |
| Secondary Cache: | 3 MB I+D on chip per core |
| Tertiary Cache: | 24 MB I+D on chip per chip |
| Other Cache: | None |
| Memory Amount (GB): | 16 |
| # and size of DIMM: | 2 x 8192 MB |
| Memory Details: | 8GB 1Rx16 PC5-6400B; slots 1 and 2 populated |
| Power Supply Quantity and Rating (W): | None |
| Power Supply Details: | Shared |
| Disk Drive: | 1 x 240GB M.2 SSD P/N:4XB7A89422 |
| Disk Controller: | Integrated SATA controller |
| # and type of Network Interface Cards (NICs) Installed: | 1 x 1GbE RJ45 |
| NICs Enabled in Firmware / OS / Connected: | 4/4/1 |
| Network Speed (Mbit): | 1000 |
| Keyboard: | None |
| Mouse: | None |
| Monitor: | None |
| Optical Drives: | No |
| Other Hardware: | None |
| Software | |
|---|---|
| Power Management: | Enabled (see SUT Notes) |
| Operating System (OS): | Ubuntu 24.04.2 LTS 64-bit |
| OS Version: | Linux 6.8.0-60-generic |
| Filesystem: | ext4 |
| JVM Vendor: | Oracle Corporation |
| JVM Version: | Java HotSpot(TM) 64-Bit Server VM (build 17.0.10+11-LTS-240, mixed mode, sharing), version 17.0.10 |
| JVM Command-line Options: | -server -Xmn450m -Xms512m -Xmx512m -XX:ParallelGCThreads=2 -XX:+UseLargePages -XX:InlineSmallCode=1500 -XX:AutoBoxCacheMax=20000 -XX:+UseParallelGC -XX:FreqInlineSize=2500 -XX:CompileThresholdScaling=210 |
| JVM Affinity: | for each physicalCore { numactl -C physicalCoreId } |
| JVM Instances: | 16 |
| JVM Initial Heap (MB): | 512 |
| JVM Maximum Heap (MB): | 512 |
| JVM Address Bits: | 64 |
| Boot Firmware Version: | DZE104U |
| Management Firmware Version: | DZX310C |
| Workload Version: | SSJ 1.2.10 |
| Director Location: | Controller |
| Other Software: | None |
| JVM Instance | ssj_ops@100% |
|---|---|
| perf-1.001 | 92,370 |
| perf-1.002 | 93,624 |
| perf-1.003 | 92,216 |
| perf-1.004 | 91,459 |
| perf-1.005 | 92,309 |
| perf-1.006 | 92,788 |
| perf-1.007 | 54,066 |
| perf-1.008 | 53,686 |
| perf-1.009 | 53,789 |
| perf-1.010 | 53,497 |
| perf-1.011 | 53,942 |
| perf-1.012 | 54,068 |
| perf-1.013 | 53,533 |
| perf-1.014 | 53,501 |
| perf-1.015 | 19,807 |
| perf-1.016 | 19,905 |
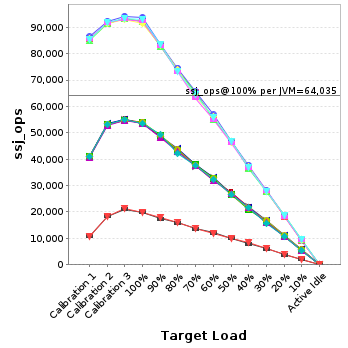
| ssj_ops@100% | 1,024,560 |
| ssj_ops@100% per JVM | 64,035 |
| Target Load | Actual Load | ssj_ops | |
|---|---|---|---|
| Target | Actual | ||
| Calibration 1 | 85,767 | ||
| Calibration 2 | 91,560 | ||
| Calibration 3 | 93,265 | ||
| ssj_ops@calibrated=92,412 | |||
| 100% | 100.0% | 92,412 | 92,370 |
| 90% | 90.3% | 83,171 | 83,407 |
| 80% | 79.8% | 73,930 | 73,715 |
| 70% | 70.7% | 64,689 | 65,374 |
| 60% | 59.8% | 55,447 | 55,280 |
| 50% | 50.6% | 46,206 | 46,725 |
| 40% | 40.0% | 36,965 | 36,942 |
| 30% | 30.0% | 27,724 | 27,746 |
| 20% | 19.7% | 18,482 | 18,167 |
| 10% | 9.8% | 9,241 | 9,081 |
| Active Idle | 0 | 0 | |

| Target Load | Actual Load | ssj_ops | |
|---|---|---|---|
| Target | Actual | ||
| Calibration 1 | 86,315 | ||
| Calibration 2 | 92,222 | ||
| Calibration 3 | 94,110 | ||
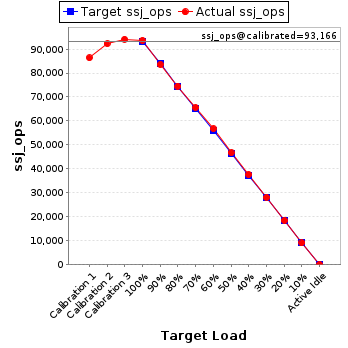
| ssj_ops@calibrated=93,166 | |||
| 100% | 100.5% | 93,166 | 93,624 |
| 90% | 89.6% | 83,849 | 83,511 |
| 80% | 80.0% | 74,533 | 74,500 |
| 70% | 70.4% | 65,216 | 65,578 |
| 60% | 60.9% | 55,900 | 56,744 |
| 50% | 50.2% | 46,583 | 46,732 |
| 40% | 40.4% | 37,266 | 37,675 |
| 30% | 30.2% | 27,950 | 28,092 |
| 20% | 19.8% | 18,633 | 18,471 |
| 10% | 9.8% | 9,317 | 9,087 |
| Active Idle | 0 | 0 | |
| Target Load | Actual Load | ssj_ops | |
|---|---|---|---|
| Target | Actual | ||
| Calibration 1 | 84,921 | ||
| Calibration 2 | 91,553 | ||
| Calibration 3 | 93,165 | ||
| ssj_ops@calibrated=92,359 | |||
| 100% | 99.8% | 92,359 | 92,216 |
| 90% | 89.7% | 83,123 | 82,813 |
| 80% | 79.6% | 73,887 | 73,542 |
| 70% | 70.7% | 64,651 | 65,273 |
| 60% | 59.7% | 55,415 | 55,147 |
| 50% | 50.7% | 46,179 | 46,827 |
| 40% | 39.6% | 36,944 | 36,617 |
| 30% | 29.9% | 27,708 | 27,657 |
| 20% | 20.1% | 18,472 | 18,537 |
| 10% | 10.4% | 9,236 | 9,625 |
| Active Idle | 0 | 0 | |

| Target Load | Actual Load | ssj_ops | |
|---|---|---|---|
| Target | Actual | ||
| Calibration 1 | 85,762 | ||
| Calibration 2 | 91,343 | ||
| Calibration 3 | 93,002 | ||
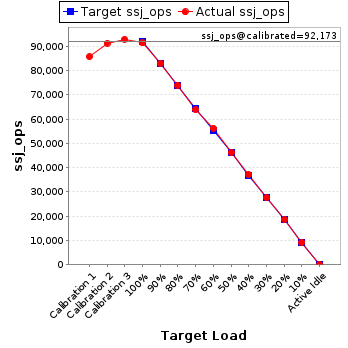
| ssj_ops@calibrated=92,173 | |||
| 100% | 99.2% | 92,173 | 91,459 |
| 90% | 90.1% | 82,956 | 83,092 |
| 80% | 80.3% | 73,738 | 74,035 |
| 70% | 69.3% | 64,521 | 63,854 |
| 60% | 61.1% | 55,304 | 56,297 |
| 50% | 50.2% | 46,086 | 46,240 |
| 40% | 40.4% | 36,869 | 37,223 |
| 30% | 30.0% | 27,652 | 27,629 |
| 20% | 20.2% | 18,435 | 18,654 |
| 10% | 9.9% | 9,217 | 9,171 |
| Active Idle | 0 | 0 | |
| Target Load | Actual Load | ssj_ops | |
|---|---|---|---|
| Target | Actual | ||
| Calibration 1 | 85,626 | ||
| Calibration 2 | 91,643 | ||
| Calibration 3 | 92,946 | ||
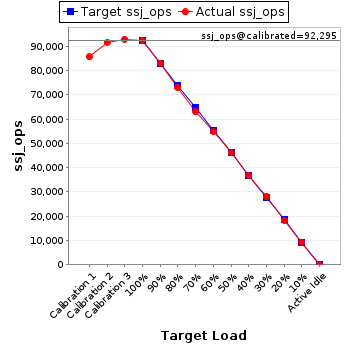
| ssj_ops@calibrated=92,295 | |||
| 100% | 100.0% | 92,295 | 92,309 |
| 90% | 90.0% | 83,065 | 83,076 |
| 80% | 79.1% | 73,836 | 73,038 |
| 70% | 68.3% | 64,606 | 63,042 |
| 60% | 59.5% | 55,377 | 54,888 |
| 50% | 49.9% | 46,147 | 46,062 |
| 40% | 39.8% | 36,918 | 36,721 |
| 30% | 30.3% | 27,688 | 27,992 |
| 20% | 19.8% | 18,459 | 18,258 |
| 10% | 9.9% | 9,229 | 9,162 |
| Active Idle | 0 | 0 | |
| Target Load | Actual Load | ssj_ops | |
|---|---|---|---|
| Target | Actual | ||
| Calibration 1 | 85,409 | ||
| Calibration 2 | 91,768 | ||
| Calibration 3 | 93,310 | ||
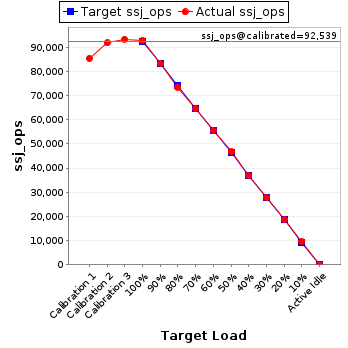
| ssj_ops@calibrated=92,539 | |||
| 100% | 100.3% | 92,539 | 92,788 |
| 90% | 90.0% | 83,285 | 83,330 |
| 80% | 79.3% | 74,031 | 73,402 |
| 70% | 69.8% | 64,777 | 64,629 |
| 60% | 60.2% | 55,523 | 55,691 |
| 50% | 50.6% | 46,269 | 46,824 |
| 40% | 39.9% | 37,016 | 36,883 |
| 30% | 30.2% | 27,762 | 27,912 |
| 20% | 20.1% | 18,508 | 18,575 |
| 10% | 10.4% | 9,254 | 9,587 |
| Active Idle | 0 | 0 | |
| Target Load | Actual Load | ssj_ops | |
|---|---|---|---|
| Target | Actual | ||
| Calibration 1 | 40,842 | ||
| Calibration 2 | 53,138 | ||
| Calibration 3 | 54,605 | ||
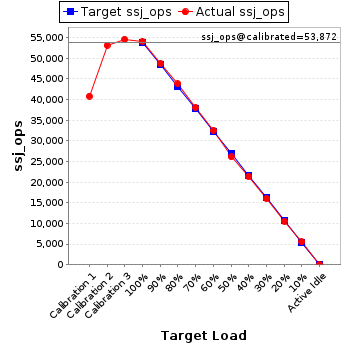
| ssj_ops@calibrated=53,872 | |||
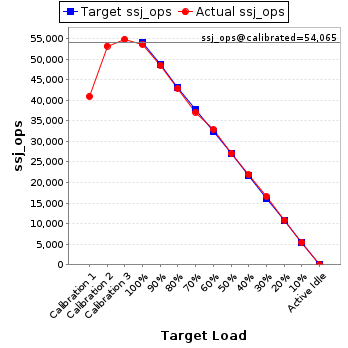
| 100% | 100.4% | 53,872 | 54,066 |
| 90% | 90.5% | 48,485 | 48,730 |
| 80% | 81.3% | 43,097 | 43,813 |
| 70% | 70.7% | 37,710 | 38,096 |
| 60% | 60.3% | 32,323 | 32,505 |
| 50% | 48.5% | 26,936 | 26,108 |
| 40% | 39.8% | 21,549 | 21,427 |
| 30% | 29.8% | 16,162 | 16,050 |
| 20% | 19.6% | 10,774 | 10,554 |
| 10% | 10.3% | 5,387 | 5,533 |
| Active Idle | 0 | 0 | |
| Target Load | Actual Load | ssj_ops | |
|---|---|---|---|
| Target | Actual | ||
| Calibration 1 | 40,970 | ||
| Calibration 2 | 53,240 | ||
| Calibration 3 | 54,891 | ||
| ssj_ops@calibrated=54,065 | |||
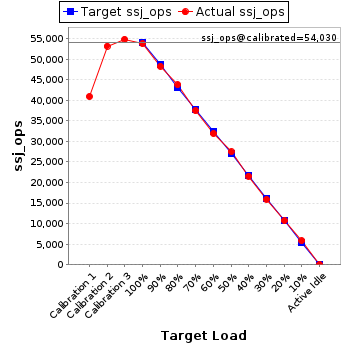
| 100% | 99.3% | 54,065 | 53,686 |
| 90% | 89.9% | 48,659 | 48,616 |
| 80% | 79.5% | 43,252 | 42,958 |
| 70% | 68.7% | 37,846 | 37,158 |
| 60% | 60.8% | 32,439 | 32,894 |
| 50% | 50.1% | 27,033 | 27,083 |
| 40% | 40.5% | 21,626 | 21,888 |
| 30% | 30.7% | 16,220 | 16,592 |
| 20% | 20.1% | 10,813 | 10,871 |
| 10% | 10.0% | 5,407 | 5,387 |
| Active Idle | 0 | 0 | |
| Target Load | Actual Load | ssj_ops | |
|---|---|---|---|
| Target | Actual | ||
| Calibration 1 | 40,918 | ||
| Calibration 2 | 53,201 | ||
| Calibration 3 | 54,859 | ||
| ssj_ops@calibrated=54,030 | |||
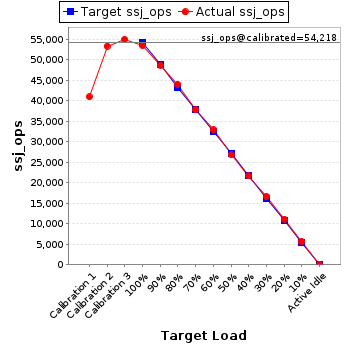
| 100% | 99.6% | 54,030 | 53,789 |
| 90% | 89.4% | 48,627 | 48,278 |
| 80% | 81.0% | 43,224 | 43,787 |
| 70% | 69.3% | 37,821 | 37,459 |
| 60% | 59.0% | 32,418 | 31,900 |
| 50% | 50.9% | 27,015 | 27,500 |
| 40% | 39.9% | 21,612 | 21,542 |
| 30% | 29.4% | 16,209 | 15,908 |
| 20% | 19.8% | 10,806 | 10,708 |
| 10% | 10.8% | 5,403 | 5,846 |
| Active Idle | 0 | 0 | |
| Target Load | Actual Load | ssj_ops | |
|---|---|---|---|
| Target | Actual | ||
| Calibration 1 | 40,951 | ||
| Calibration 2 | 53,385 | ||
| Calibration 3 | 55,052 | ||
| ssj_ops@calibrated=54,218 | |||
| 100% | 98.7% | 54,218 | 53,497 |
| 90% | 89.9% | 48,797 | 48,758 |
| 80% | 81.3% | 43,375 | 44,068 |
| 70% | 69.9% | 37,953 | 37,876 |
| 60% | 60.7% | 32,531 | 32,912 |
| 50% | 49.4% | 27,109 | 26,788 |
| 40% | 39.9% | 21,687 | 21,653 |
| 30% | 30.7% | 16,266 | 16,658 |
| 20% | 20.5% | 10,844 | 11,133 |
| 10% | 10.3% | 5,422 | 5,608 |
| Active Idle | 0 | 0 | |
| Target Load | Actual Load | ssj_ops | |
|---|---|---|---|
| Target | Actual | ||
| Calibration 1 | 40,815 | ||
| Calibration 2 | 53,190 | ||
| Calibration 3 | 54,753 | ||
| ssj_ops@calibrated=53,972 | |||
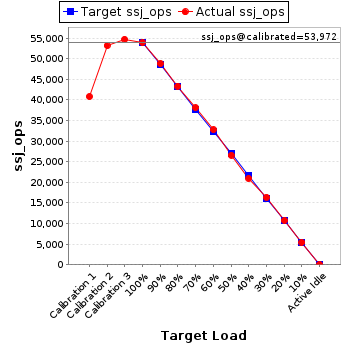
| 100% | 99.9% | 53,972 | 53,942 |
| 90% | 90.5% | 48,575 | 48,838 |
| 80% | 80.3% | 43,177 | 43,358 |
| 70% | 70.6% | 37,780 | 38,113 |
| 60% | 60.7% | 32,383 | 32,786 |
| 50% | 49.3% | 26,986 | 26,582 |
| 40% | 38.8% | 21,589 | 20,942 |
| 30% | 30.4% | 16,192 | 16,383 |
| 20% | 19.9% | 10,794 | 10,753 |
| 10% | 10.1% | 5,397 | 5,437 |
| Active Idle | 0 | 0 | |
| Target Load | Actual Load | ssj_ops | |
|---|---|---|---|
| Target | Actual | ||
| Calibration 1 | 40,834 | ||
| Calibration 2 | 53,171 | ||
| Calibration 3 | 54,822 | ||
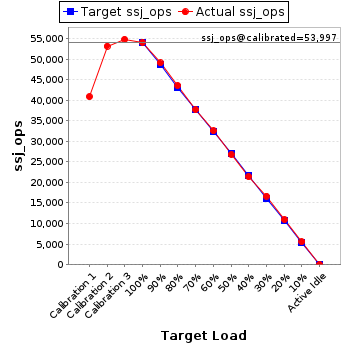
| ssj_ops@calibrated=53,997 | |||
| 100% | 100.1% | 53,997 | 54,068 |
| 90% | 90.9% | 48,597 | 49,060 |
| 80% | 80.7% | 43,197 | 43,568 |
| 70% | 69.8% | 37,798 | 37,681 |
| 60% | 60.3% | 32,398 | 32,543 |
| 50% | 49.6% | 26,998 | 26,772 |
| 40% | 39.6% | 21,599 | 21,375 |
| 30% | 30.9% | 16,199 | 16,695 |
| 20% | 20.4% | 10,799 | 10,992 |
| 10% | 10.3% | 5,400 | 5,562 |
| Active Idle | 0 | 0 | |
| Target Load | Actual Load | ssj_ops | |
|---|---|---|---|
| Target | Actual | ||
| Calibration 1 | 40,503 | ||
| Calibration 2 | 52,926 | ||
| Calibration 3 | 54,672 | ||
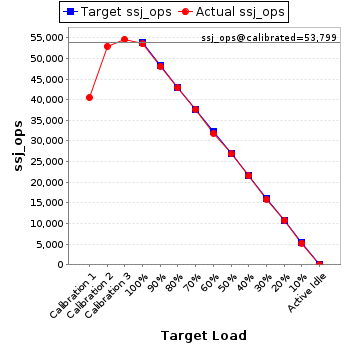
| ssj_ops@calibrated=53,799 | |||
| 100% | 99.5% | 53,799 | 53,533 |
| 90% | 89.4% | 48,419 | 48,111 |
| 80% | 79.7% | 43,039 | 42,891 |
| 70% | 69.9% | 37,659 | 37,620 |
| 60% | 59.2% | 32,279 | 31,850 |
| 50% | 49.9% | 26,899 | 26,846 |
| 40% | 40.0% | 21,520 | 21,517 |
| 30% | 29.4% | 16,140 | 15,838 |
| 20% | 20.0% | 10,760 | 10,773 |
| 10% | 9.8% | 5,380 | 5,246 |
| Active Idle | 0 | 0 | |
| Target Load | Actual Load | ssj_ops | |
|---|---|---|---|
| Target | Actual | ||
| Calibration 1 | 40,857 | ||
| Calibration 2 | 53,132 | ||
| Calibration 3 | 54,896 | ||
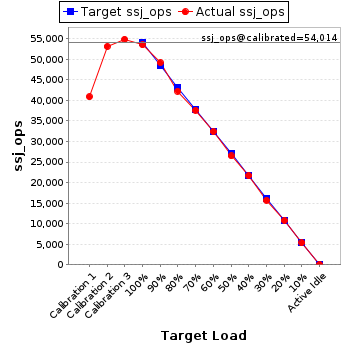
| ssj_ops@calibrated=54,014 | |||
| 100% | 99.1% | 54,014 | 53,501 |
| 90% | 91.0% | 48,613 | 49,176 |
| 80% | 78.2% | 43,211 | 42,254 |
| 70% | 69.6% | 37,810 | 37,599 |
| 60% | 60.0% | 32,408 | 32,406 |
| 50% | 49.0% | 27,007 | 26,473 |
| 40% | 40.1% | 21,606 | 21,658 |
| 30% | 29.0% | 16,204 | 15,681 |
| 20% | 19.9% | 10,803 | 10,767 |
| 10% | 9.8% | 5,401 | 5,317 |
| Active Idle | 0 | 0 | |
| Target Load | Actual Load | ssj_ops | |
|---|---|---|---|
| Target | Actual | ||
| Calibration 1 | 10,866 | ||
| Calibration 2 | 18,287 | ||
| Calibration 3 | 21,091 | ||
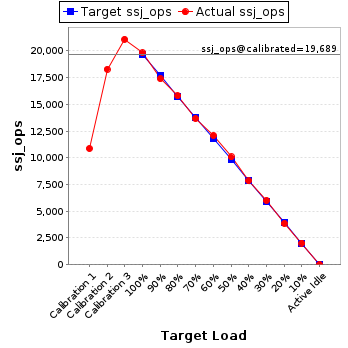
| ssj_ops@calibrated=19,689 | |||
| 100% | 100.6% | 19,689 | 19,807 |
| 90% | 88.3% | 17,720 | 17,387 |
| 80% | 80.2% | 15,751 | 15,800 |
| 70% | 69.5% | 13,782 | 13,674 |
| 60% | 61.4% | 11,813 | 12,083 |
| 50% | 51.2% | 9,844 | 10,075 |
| 40% | 39.8% | 7,875 | 7,837 |
| 30% | 30.5% | 5,907 | 6,012 |
| 20% | 19.6% | 3,938 | 3,850 |
| 10% | 10.3% | 1,969 | 2,025 |
| Active Idle | 0 | 0 | |
| Target Load | Actual Load | ssj_ops | |
|---|---|---|---|
| Target | Actual | ||
| Calibration 1 | 10,759 | ||
| Calibration 2 | 18,318 | ||
| Calibration 3 | 21,317 | ||
| ssj_ops@calibrated=19,818 | |||
| 100% | 100.4% | 19,818 | 19,905 |
| 90% | 89.3% | 17,836 | 17,691 |
| 80% | 81.3% | 15,854 | 16,104 |
| 70% | 70.1% | 13,872 | 13,883 |
| 60% | 59.3% | 11,891 | 11,754 |
| 50% | 50.2% | 9,909 | 9,949 |
| 40% | 41.6% | 7,927 | 8,242 |
| 30% | 30.8% | 5,945 | 6,104 |
| 20% | 20.1% | 3,964 | 3,987 |
| 10% | 10.7% | 1,982 | 2,125 |
| Active Idle | 0 | 0 | |