SPECpower_ssj2008
Host 'perf-2' Performance Report
Copyright © 2007-2025 Standard Performance Evaluation Corporation
| Lenovo Global Technology ThinkEdge SE100 | ssj_ops@100% = 1,029,857 ssj_ops@100% per JVM = 64,366 |
||||
| Test Sponsor: | Lenovo Global Technology | SPEC License #: | 9017 | Test Method: | Multi Node |
| Tested By: | Lenovo Global Technology | Test Location: | Beijing, China | Test Date: | Jun 12, 2025 |
| Hardware Availability: | May-2025 | Software Availability: | Feb-2025 | Publication: | Jul 1, 2025 |
| System Source: | Single Supplier | System Designation: | Server | Power Provisioning: | Line-powered |
| Target Load | Actual Load | ssj_ops | |
|---|---|---|---|
| Target | Actual | ||
| Calibration 1 | 864,206 | ||
| Calibration 2 | 1,014,786 | ||
| Calibration 3 | 1,043,410 | ||
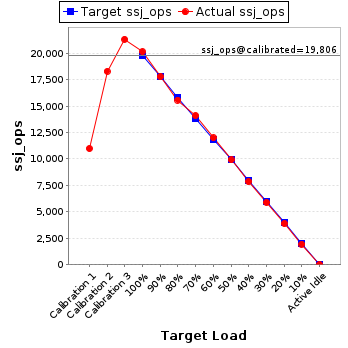
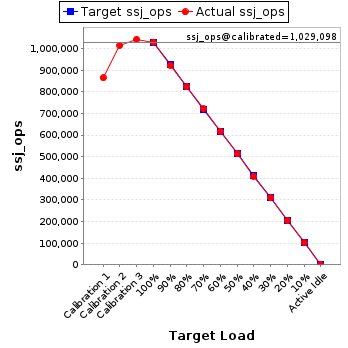
| ssj_ops@calibrated=1,029,098 | |||
| 100% | 100.1% | 1,029,098 | 1,029,857 |
| 90% | 89.7% | 926,188 | 922,662 |
| 80% | 80.0% | 823,279 | 822,905 |
| 70% | 70.0% | 720,369 | 720,540 |
| 60% | 60.1% | 617,459 | 618,524 |
| 50% | 50.0% | 514,549 | 514,144 |
| 40% | 39.9% | 411,639 | 410,258 |
| 30% | 30.1% | 308,729 | 309,559 |
| 20% | 20.0% | 205,820 | 205,857 |
| 10% | 9.8% | 102,910 | 101,278 |
| Active Idle | 0 | 0 | |
| Set Identifier: | sut |
| Set Description: | System Under Test |
| # of Identical Nodes: | 2 |
| Comment: | 'SUT' |
| Hardware | |
|---|---|
| Hardware Vendor: | Lenovo Global Technology |
| Model: | ThinkEdge SE100 |
| Form Factor: | 1U |
| CPU Name: | Intel Core Ultra 7 255H |
| CPU Characteristics: | 16 Core, 2.0GHz, 24MB L3 Cache |
| CPU Frequency (MHz): | 2000 |
| CPU(s) Enabled: | 16 cores, 1 chip, 16 cores/chip |
| Hardware Threads: | 16 (1 / core) |
| CPU(s) Orderable: | 1 chip |
| Primary Cache: | 64 KB I + 48 KB D on chip per core |
| Secondary Cache: | 3 MB I+D on chip per core |
| Tertiary Cache: | 24 MB I+D on chip per chip |
| Other Cache: | None |
| Memory Amount (GB): | 16 |
| # and size of DIMM: | 2 x 8192 MB |
| Memory Details: | 8GB 1Rx16 PC5-6400B; slots 1 and 2 populated |
| Power Supply Quantity and Rating (W): | None |
| Power Supply Details: | Shared |
| Disk Drive: | 1 x 240GB M.2 SSD P/N:4XB7A89422 |
| Disk Controller: | Integrated SATA controller |
| # and type of Network Interface Cards (NICs) Installed: | 1 x 1GbE RJ45 |
| NICs Enabled in Firmware / OS / Connected: | 4/4/1 |
| Network Speed (Mbit): | 1000 |
| Keyboard: | None |
| Mouse: | None |
| Monitor: | None |
| Optical Drives: | No |
| Other Hardware: | None |
| Software | |
|---|---|
| Power Management: | Enabled (see SUT Notes) |
| Operating System (OS): | Ubuntu 24.04.2 LTS 64-bit |
| OS Version: | Linux 6.8.0-60-generic |
| Filesystem: | ext4 |
| JVM Vendor: | Oracle Corporation |
| JVM Version: | Java HotSpot(TM) 64-Bit Server VM (build 17.0.10+11-LTS-240, mixed mode, sharing), version 17.0.10 |
| JVM Command-line Options: | -server -Xmn450m -Xms512m -Xmx512m -XX:ParallelGCThreads=2 -XX:+UseLargePages -XX:InlineSmallCode=1500 -XX:AutoBoxCacheMax=20000 -XX:+UseParallelGC -XX:FreqInlineSize=2500 -XX:CompileThresholdScaling=210 |
| JVM Affinity: | for each physicalCore { numactl -C physicalCoreId } |
| JVM Instances: | 16 |
| JVM Initial Heap (MB): | 512 |
| JVM Maximum Heap (MB): | 512 |
| JVM Address Bits: | 64 |
| Boot Firmware Version: | DZE104U |
| Management Firmware Version: | DZX310C |
| Workload Version: | SSJ 1.2.10 |
| Director Location: | Controller |
| Other Software: | None |
| JVM Instance | ssj_ops@100% |
|---|---|
| perf-2.001 | 92,876 |
| perf-2.002 | 92,779 |
| perf-2.003 | 92,362 |
| perf-2.004 | 92,716 |
| perf-2.005 | 93,955 |
| perf-2.006 | 93,190 |
| perf-2.007 | 54,030 |
| perf-2.008 | 54,171 |
| perf-2.009 | 54,132 |
| perf-2.010 | 53,790 |
| perf-2.011 | 54,082 |
| perf-2.012 | 54,231 |
| perf-2.013 | 54,381 |
| perf-2.014 | 53,691 |
| perf-2.015 | 19,338 |
| perf-2.016 | 20,134 |
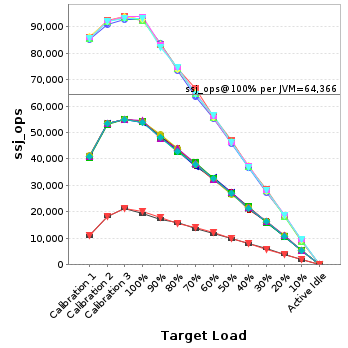
| ssj_ops@100% | 1,029,857 |
| ssj_ops@100% per JVM | 64,366 |
| Target Load | Actual Load | ssj_ops | |
|---|---|---|---|
| Target | Actual | ||
| Calibration 1 | 86,022 | ||
| Calibration 2 | 92,237 | ||
| Calibration 3 | 93,831 | ||
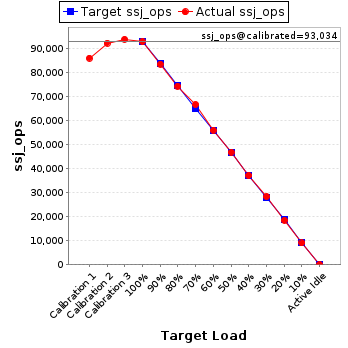
| ssj_ops@calibrated=93,034 | |||
| 100% | 99.8% | 93,034 | 92,876 |
| 90% | 89.7% | 83,730 | 83,475 |
| 80% | 79.9% | 74,427 | 74,307 |
| 70% | 71.7% | 65,124 | 66,681 |
| 60% | 60.2% | 55,820 | 55,993 |
| 50% | 50.3% | 46,517 | 46,826 |
| 40% | 39.9% | 37,213 | 37,144 |
| 30% | 30.5% | 27,910 | 28,374 |
| 20% | 19.9% | 18,607 | 18,487 |
| 10% | 9.7% | 9,303 | 9,024 |
| Active Idle | 0 | 0 | |
| Target Load | Actual Load | ssj_ops | |
|---|---|---|---|
| Target | Actual | ||
| Calibration 1 | 85,301 | ||
| Calibration 2 | 91,066 | ||
| Calibration 3 | 92,937 | ||
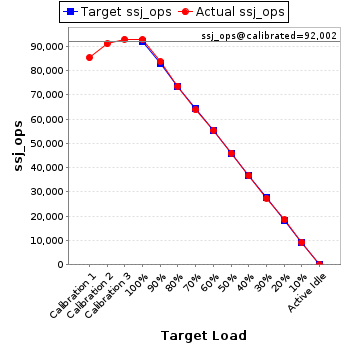
| ssj_ops@calibrated=92,002 | |||
| 100% | 100.8% | 92,002 | 92,779 |
| 90% | 91.0% | 82,802 | 83,716 |
| 80% | 80.0% | 73,601 | 73,568 |
| 70% | 69.3% | 64,401 | 63,797 |
| 60% | 60.2% | 55,201 | 55,358 |
| 50% | 49.9% | 46,001 | 45,954 |
| 40% | 39.8% | 36,801 | 36,604 |
| 30% | 29.8% | 27,601 | 27,462 |
| 20% | 20.1% | 18,400 | 18,478 |
| 10% | 10.0% | 9,200 | 9,225 |
| Active Idle | 0 | 0 | |
| Target Load | Actual Load | ssj_ops | |
|---|---|---|---|
| Target | Actual | ||
| Calibration 1 | 85,660 | ||
| Calibration 2 | 91,879 | ||
| Calibration 3 | 93,650 | ||
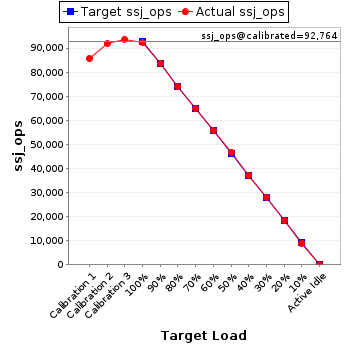
| ssj_ops@calibrated=92,764 | |||
| 100% | 99.6% | 92,764 | 92,362 |
| 90% | 90.1% | 83,488 | 83,548 |
| 80% | 79.9% | 74,211 | 74,079 |
| 70% | 69.8% | 64,935 | 64,765 |
| 60% | 59.9% | 55,659 | 55,592 |
| 50% | 50.3% | 46,382 | 46,700 |
| 40% | 39.9% | 37,106 | 37,008 |
| 30% | 30.3% | 27,829 | 28,095 |
| 20% | 19.8% | 18,553 | 18,337 |
| 10% | 9.6% | 9,276 | 8,937 |
| Active Idle | 0 | 0 | |
| Target Load | Actual Load | ssj_ops | |
|---|---|---|---|
| Target | Actual | ||
| Calibration 1 | 86,206 | ||
| Calibration 2 | 91,960 | ||
| Calibration 3 | 93,752 | ||
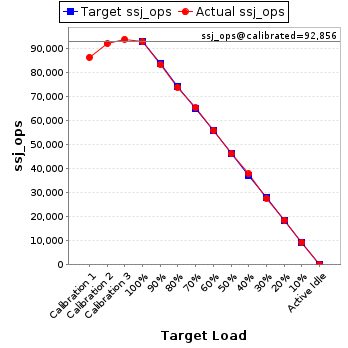
| ssj_ops@calibrated=92,856 | |||
| 100% | 99.8% | 92,856 | 92,716 |
| 90% | 89.6% | 83,570 | 83,189 |
| 80% | 79.4% | 74,285 | 73,755 |
| 70% | 70.2% | 64,999 | 65,161 |
| 60% | 60.0% | 55,713 | 55,684 |
| 50% | 49.6% | 46,428 | 46,085 |
| 40% | 40.6% | 37,142 | 37,712 |
| 30% | 29.8% | 27,857 | 27,702 |
| 20% | 20.0% | 18,571 | 18,550 |
| 10% | 9.9% | 9,286 | 9,217 |
| Active Idle | 0 | 0 | |
| Target Load | Actual Load | ssj_ops | |
|---|---|---|---|
| Target | Actual | ||
| Calibration 1 | 85,699 | ||
| Calibration 2 | 92,088 | ||
| Calibration 3 | 93,846 | ||
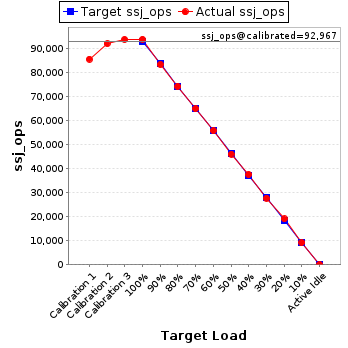
| ssj_ops@calibrated=92,967 | |||
| 100% | 101.1% | 92,967 | 93,955 |
| 90% | 89.7% | 83,670 | 83,392 |
| 80% | 79.9% | 74,374 | 74,302 |
| 70% | 69.9% | 65,077 | 65,002 |
| 60% | 60.0% | 55,780 | 55,822 |
| 50% | 49.6% | 46,484 | 46,087 |
| 40% | 40.5% | 37,187 | 37,642 |
| 30% | 29.9% | 27,890 | 27,760 |
| 20% | 20.5% | 18,593 | 19,067 |
| 10% | 9.9% | 9,297 | 9,208 |
| Active Idle | 0 | 0 | |
| Target Load | Actual Load | ssj_ops | |
|---|---|---|---|
| Target | Actual | ||
| Calibration 1 | 85,782 | ||
| Calibration 2 | 91,900 | ||
| Calibration 3 | 93,207 | ||
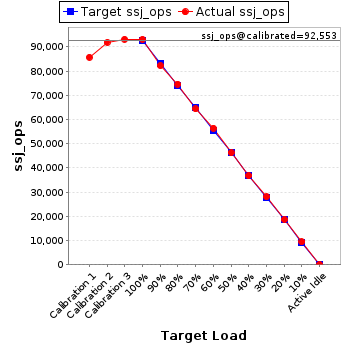
| ssj_ops@calibrated=92,553 | |||
| 100% | 100.7% | 92,553 | 93,190 |
| 90% | 88.9% | 83,298 | 82,261 |
| 80% | 80.7% | 74,043 | 74,677 |
| 70% | 69.6% | 64,787 | 64,371 |
| 60% | 61.0% | 55,532 | 56,474 |
| 50% | 50.0% | 46,277 | 46,304 |
| 40% | 39.7% | 37,021 | 36,766 |
| 30% | 30.3% | 27,766 | 28,045 |
| 20% | 20.2% | 18,511 | 18,675 |
| 10% | 10.2% | 9,255 | 9,411 |
| Active Idle | 0 | 0 | |
| Target Load | Actual Load | ssj_ops | |
|---|---|---|---|
| Target | Actual | ||
| Calibration 1 | 40,965 | ||
| Calibration 2 | 53,454 | ||
| Calibration 3 | 54,867 | ||
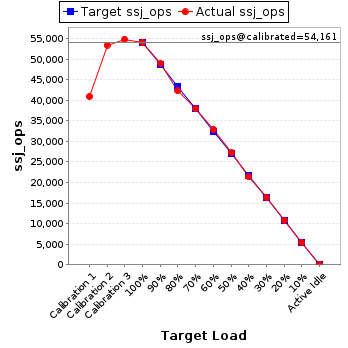
| ssj_ops@calibrated=54,161 | |||
| 100% | 99.8% | 54,161 | 54,030 |
| 90% | 90.4% | 48,745 | 48,950 |
| 80% | 78.1% | 43,329 | 42,291 |
| 70% | 70.0% | 37,913 | 37,910 |
| 60% | 60.8% | 32,497 | 32,908 |
| 50% | 50.2% | 27,080 | 27,188 |
| 40% | 39.4% | 21,664 | 21,362 |
| 30% | 30.3% | 16,248 | 16,400 |
| 20% | 20.0% | 10,832 | 10,842 |
| 10% | 9.9% | 5,416 | 5,358 |
| Active Idle | 0 | 0 | |
| Target Load | Actual Load | ssj_ops | |
|---|---|---|---|
| Target | Actual | ||
| Calibration 1 | 40,894 | ||
| Calibration 2 | 53,313 | ||
| Calibration 3 | 54,892 | ||
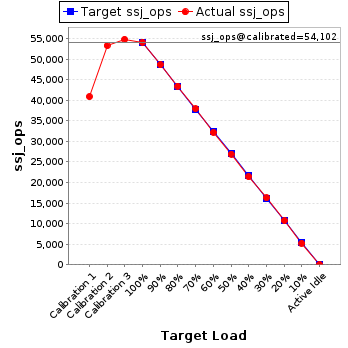
| ssj_ops@calibrated=54,102 | |||
| 100% | 100.1% | 54,102 | 54,171 |
| 90% | 90.0% | 48,692 | 48,668 |
| 80% | 80.3% | 43,282 | 43,471 |
| 70% | 70.2% | 37,872 | 37,961 |
| 60% | 59.5% | 32,461 | 32,208 |
| 50% | 49.8% | 27,051 | 26,939 |
| 40% | 39.5% | 21,641 | 21,392 |
| 30% | 30.0% | 16,231 | 16,246 |
| 20% | 19.8% | 10,820 | 10,725 |
| 10% | 9.6% | 5,410 | 5,208 |
| Active Idle | 0 | 0 | |
| Target Load | Actual Load | ssj_ops | |
|---|---|---|---|
| Target | Actual | ||
| Calibration 1 | 41,003 | ||
| Calibration 2 | 53,539 | ||
| Calibration 3 | 55,116 | ||
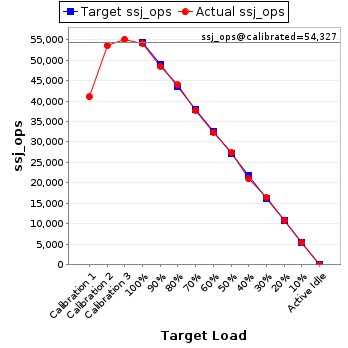
| ssj_ops@calibrated=54,327 | |||
| 100% | 99.6% | 54,327 | 54,132 |
| 90% | 89.3% | 48,895 | 48,537 |
| 80% | 80.9% | 43,462 | 43,942 |
| 70% | 69.4% | 38,029 | 37,692 |
| 60% | 59.5% | 32,596 | 32,334 |
| 50% | 50.4% | 27,164 | 27,383 |
| 40% | 38.6% | 21,731 | 20,946 |
| 30% | 30.2% | 16,298 | 16,400 |
| 20% | 19.9% | 10,865 | 10,816 |
| 10% | 9.8% | 5,433 | 5,346 |
| Active Idle | 0 | 0 | |
| Target Load | Actual Load | ssj_ops | |
|---|---|---|---|
| Target | Actual | ||
| Calibration 1 | 41,079 | ||
| Calibration 2 | 53,550 | ||
| Calibration 3 | 55,129 | ||
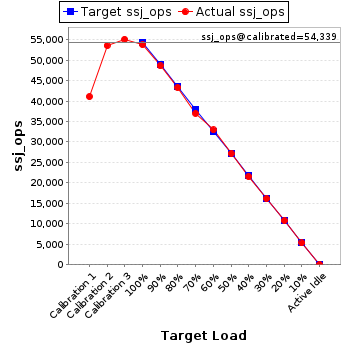
| ssj_ops@calibrated=54,339 | |||
| 100% | 99.0% | 54,339 | 53,790 |
| 90% | 89.4% | 48,906 | 48,595 |
| 80% | 79.7% | 43,472 | 43,294 |
| 70% | 68.1% | 38,038 | 36,997 |
| 60% | 60.6% | 32,604 | 32,957 |
| 50% | 50.0% | 27,170 | 27,160 |
| 40% | 39.6% | 21,736 | 21,498 |
| 30% | 29.7% | 16,302 | 16,120 |
| 20% | 19.8% | 10,868 | 10,758 |
| 10% | 9.8% | 5,434 | 5,300 |
| Active Idle | 0 | 0 | |
| Target Load | Actual Load | ssj_ops | |
|---|---|---|---|
| Target | Actual | ||
| Calibration 1 | 40,718 | ||
| Calibration 2 | 53,232 | ||
| Calibration 3 | 54,842 | ||
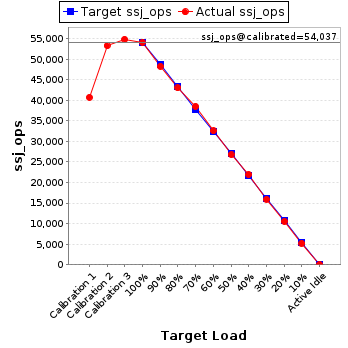
| ssj_ops@calibrated=54,037 | |||
| 100% | 100.1% | 54,037 | 54,082 |
| 90% | 89.3% | 48,633 | 48,246 |
| 80% | 79.6% | 43,230 | 43,009 |
| 70% | 71.3% | 37,826 | 38,522 |
| 60% | 60.2% | 32,422 | 32,550 |
| 50% | 49.5% | 27,019 | 26,754 |
| 40% | 40.7% | 21,615 | 21,971 |
| 30% | 29.5% | 16,211 | 15,917 |
| 20% | 19.4% | 10,807 | 10,496 |
| 10% | 9.6% | 5,404 | 5,175 |
| Active Idle | 0 | 0 | |
| Target Load | Actual Load | ssj_ops | |
|---|---|---|---|
| Target | Actual | ||
| Calibration 1 | 41,211 | ||
| Calibration 2 | 53,324 | ||
| Calibration 3 | 54,895 | ||
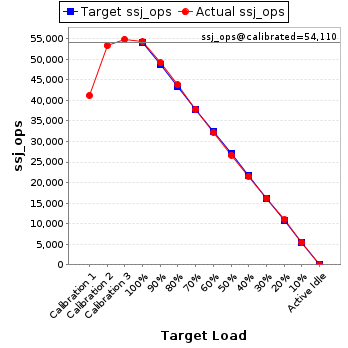
| ssj_ops@calibrated=54,110 | |||
| 100% | 100.2% | 54,110 | 54,231 |
| 90% | 90.9% | 48,699 | 49,182 |
| 80% | 81.0% | 43,288 | 43,823 |
| 70% | 70.1% | 37,877 | 37,905 |
| 60% | 59.4% | 32,466 | 32,127 |
| 50% | 49.3% | 27,055 | 26,675 |
| 40% | 39.8% | 21,644 | 21,537 |
| 30% | 30.0% | 16,233 | 16,229 |
| 20% | 20.3% | 10,822 | 10,983 |
| 10% | 10.0% | 5,411 | 5,429 |
| Active Idle | 0 | 0 | |
| Target Load | Actual Load | ssj_ops | |
|---|---|---|---|
| Target | Actual | ||
| Calibration 1 | 40,885 | ||
| Calibration 2 | 53,361 | ||
| Calibration 3 | 54,957 | ||
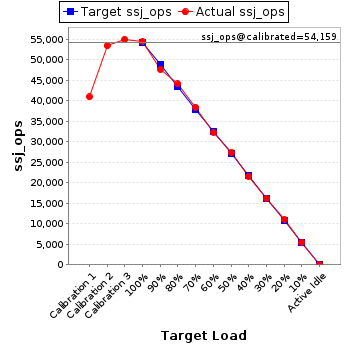
| ssj_ops@calibrated=54,159 | |||
| 100% | 100.4% | 54,159 | 54,381 |
| 90% | 87.9% | 48,743 | 47,610 |
| 80% | 81.3% | 43,327 | 44,051 |
| 70% | 70.8% | 37,911 | 38,349 |
| 60% | 59.6% | 32,496 | 32,275 |
| 50% | 50.4% | 27,080 | 27,304 |
| 40% | 39.9% | 21,664 | 21,601 |
| 30% | 29.9% | 16,248 | 16,206 |
| 20% | 20.3% | 10,832 | 11,000 |
| 10% | 10.1% | 5,416 | 5,444 |
| Active Idle | 0 | 0 | |
| Target Load | Actual Load | ssj_ops | |
|---|---|---|---|
| Target | Actual | ||
| Calibration 1 | 40,886 | ||
| Calibration 2 | 53,322 | ||
| Calibration 3 | 54,818 | ||
| ssj_ops@calibrated=54,070 | |||
| 100% | 99.3% | 54,070 | 53,691 |
| 90% | 89.3% | 48,663 | 48,270 |
| 80% | 79.2% | 43,256 | 42,835 |
| 70% | 69.8% | 37,849 | 37,763 |
| 60% | 60.1% | 32,442 | 32,474 |
| 50% | 50.0% | 27,035 | 27,021 |
| 40% | 39.6% | 21,628 | 21,389 |
| 30% | 30.4% | 16,221 | 16,462 |
| 20% | 20.0% | 10,814 | 10,825 |
| 10% | 9.7% | 5,407 | 5,237 |
| Active Idle | 0 | 0 | |

| Target Load | Actual Load | ssj_ops | |
|---|---|---|---|
| Target | Actual | ||
| Calibration 1 | 10,914 | ||
| Calibration 2 | 18,271 | ||
| Calibration 3 | 21,349 | ||
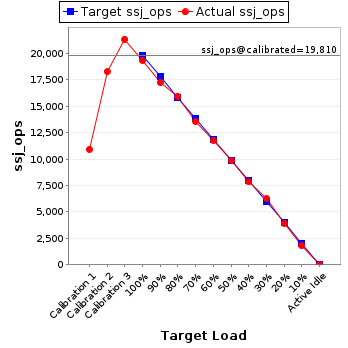
| ssj_ops@calibrated=19,810 | |||
| 100% | 97.6% | 19,810 | 19,338 |
| 90% | 87.0% | 17,829 | 17,243 |
| 80% | 80.4% | 15,848 | 15,931 |
| 70% | 68.5% | 13,867 | 13,563 |
| 60% | 59.4% | 11,886 | 11,774 |
| 50% | 49.7% | 9,905 | 9,843 |
| 40% | 39.5% | 7,924 | 7,834 |
| 30% | 31.6% | 5,943 | 6,258 |
| 20% | 19.9% | 3,962 | 3,937 |
| 10% | 9.1% | 1,981 | 1,811 |
| Active Idle | 0 | 0 | |
| Target Load | Actual Load | ssj_ops | |
|---|---|---|---|
| Target | Actual | ||
| Calibration 1 | 10,983 | ||
| Calibration 2 | 18,290 | ||
| Calibration 3 | 21,322 | ||
| ssj_ops@calibrated=19,806 | |||
| 100% | 101.7% | 19,806 | 20,134 |
| 90% | 89.8% | 17,825 | 17,779 |
| 80% | 78.6% | 15,845 | 15,571 |
| 70% | 71.2% | 13,864 | 14,100 |
| 60% | 60.6% | 11,884 | 11,994 |
| 50% | 50.1% | 9,903 | 9,921 |
| 40% | 39.6% | 7,922 | 7,850 |
| 30% | 29.7% | 5,942 | 5,883 |
| 20% | 19.6% | 3,961 | 3,879 |
| 10% | 9.8% | 1,981 | 1,946 |
| Active Idle | 0 | 0 | |