SPECpower_ssj2008
Host 'perf-1' Performance Report
Copyright © 2007-2025 Standard Performance Evaluation Corporation
| Lenovo Global Technology ThinkEdge SE100 | ssj_ops@100% = 992,238 ssj_ops@100% per JVM = 62,015 |
||||
| Test Sponsor: | Lenovo Global Technology | SPEC License #: | 9017 | Test Method: | Multi Node |
| Tested By: | Lenovo Global Technology | Test Location: | Beijing, China | Test Date: | Sep 1, 2025 |
| Hardware Availability: | May-2025 | Software Availability: | Feb-2025 | Publication: | Sep 26, 2025 |
| System Source: | Single Supplier | System Designation: | Server | Power Provisioning: | Line-powered |
| Target Load | Actual Load | ssj_ops | |
|---|---|---|---|
| Target | Actual | ||
| Calibration 1 | 833,862 | ||
| Calibration 2 | 978,332 | ||
| Calibration 3 | 1,008,557 | ||
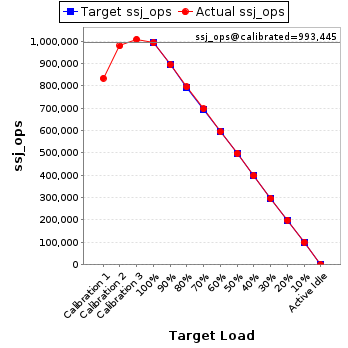
| ssj_ops@calibrated=993,445 | |||
| 100% | 99.9% | 993,445 | 992,238 |
| 90% | 90.0% | 894,100 | 894,191 |
| 80% | 80.0% | 794,756 | 795,065 |
| 70% | 70.1% | 695,411 | 696,726 |
| 60% | 59.8% | 596,067 | 594,381 |
| 50% | 50.1% | 496,722 | 497,460 |
| 40% | 40.1% | 397,378 | 398,056 |
| 30% | 29.9% | 298,033 | 296,761 |
| 20% | 20.0% | 198,689 | 198,882 |
| 10% | 10.1% | 99,344 | 100,383 |
| Active Idle | 0 | 0 | |
| Set Identifier: | sut |
| Set Description: | System Under Test |
| # of Identical Nodes: | 3 |
| Comment: | 'SUT' |
| Hardware | |
|---|---|
| Hardware Vendor: | Lenovo Global Technology |
| Model: | ThinkEdge SE100 |
| Form Factor: | 1U |
| CPU Name: | Intel Core Ultra 7 255H |
| CPU Characteristics: | 16 Core, 2.0GHz, 24MB L3 Cache |
| CPU Frequency (MHz): | 2000 |
| CPU(s) Enabled: | 16 cores, 1 chip, 16 cores/chip |
| Hardware Threads: | 16 (1 / core) |
| CPU(s) Orderable: | 1 chip |
| Primary Cache: | 64 KB I + 48 KB D on chip per core |
| Secondary Cache: | 3 MB I+D on chip per core |
| Tertiary Cache: | 24 MB I+D on chip per chip |
| Other Cache: | None |
| Memory Amount (GB): | 16 |
| # and size of DIMM: | 2 x 8192 MB |
| Memory Details: | 8GB 1Rx16 PC5-6400B; slots 1 and 2 populated |
| Power Supply Quantity and Rating (W): | None |
| Power Supply Details: | Shared |
| Disk Drive: | 1 x 240GB M.2 SSD P/N:4XB7A89422 |
| Disk Controller: | Integrated SATA controller |
| # and type of Network Interface Cards (NICs) Installed: | 1 x 1GbE RJ45 |
| NICs Enabled in Firmware / OS / Connected: | 4/4/1 |
| Network Speed (Mbit): | 1000 |
| Keyboard: | None |
| Mouse: | None |
| Monitor: | None |
| Optical Drives: | No |
| Other Hardware: | None |
| Software | |
|---|---|
| Power Management: | Enabled (see SUT Notes) |
| Operating System (OS): | Ubuntu 24.04.2 LTS 64-bit |
| OS Version: | Linux 6.8.0-60-generic |
| Filesystem: | ext4 |
| JVM Vendor: | Oracle Corporation |
| JVM Version: | Java HotSpot(TM) 64-Bit Server VM (build 17.0.10+11-LTS-240, mixed mode, sharing), version 17.0.10 |
| JVM Command-line Options: | -server -Xmn450m -Xms512m -Xmx512m -XX:ParallelGCThreads=2 -XX:+UseLargePages -XX:InlineSmallCode=1500 -XX:AutoBoxCacheMax=20000 -XX:+UseParallelGC -XX:FreqInlineSize=2500 -XX:CompileThresholdScaling=210 |
| JVM Affinity: | for each physicalCore { numactl -C physicalCoreId } |
| JVM Instances: | 16 |
| JVM Initial Heap (MB): | 512 |
| JVM Maximum Heap (MB): | 512 |
| JVM Address Bits: | 64 |
| Boot Firmware Version: | DZE104U |
| Management Firmware Version: | DZX310C |
| Workload Version: | SSJ 1.2.10 |
| Director Location: | Controller |
| Other Software: | None |
| JVM Instance | ssj_ops@100% |
|---|---|
| perf-1.001 | 89,739 |
| perf-1.002 | 90,095 |
| perf-1.003 | 90,407 |
| perf-1.004 | 90,041 |
| perf-1.005 | 89,798 |
| perf-1.006 | 88,975 |
| perf-1.007 | 52,185 |
| perf-1.008 | 52,160 |
| perf-1.009 | 52,951 |
| perf-1.010 | 52,199 |
| perf-1.011 | 51,788 |
| perf-1.012 | 53,442 |
| perf-1.013 | 52,431 |
| perf-1.014 | 52,823 |
| perf-1.015 | 16,565 |
| perf-1.016 | 16,637 |
| ssj_ops@100% | 992,238 |
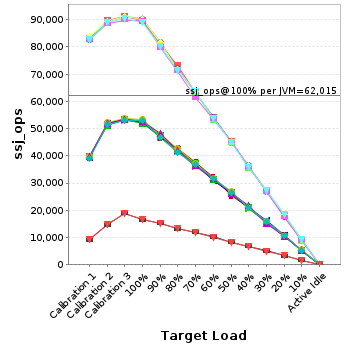
| ssj_ops@100% per JVM | 62,015 |
| Target Load | Actual Load | ssj_ops | |
|---|---|---|---|
| Target | Actual | ||
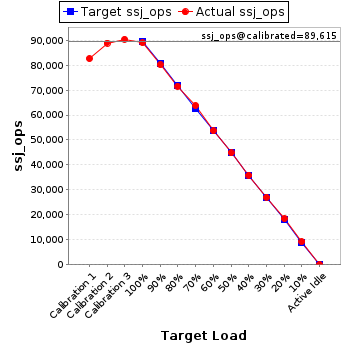
| Calibration 1 | 83,145 | ||
| Calibration 2 | 89,604 | ||
| Calibration 3 | 91,055 | ||
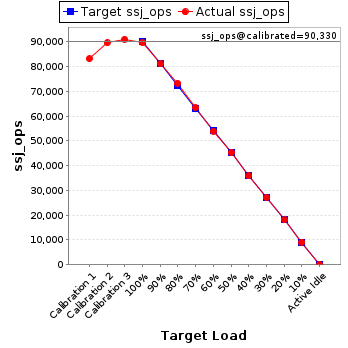
| ssj_ops@calibrated=90,330 | |||
| 100% | 99.3% | 90,330 | 89,739 |
| 90% | 89.8% | 81,297 | 81,082 |
| 80% | 81.2% | 72,264 | 73,310 |
| 70% | 70.2% | 63,231 | 63,447 |
| 60% | 59.7% | 54,198 | 53,942 |
| 50% | 50.1% | 45,165 | 45,238 |
| 40% | 39.7% | 36,132 | 35,846 |
| 30% | 30.2% | 27,099 | 27,242 |
| 20% | 20.0% | 18,066 | 18,059 |
| 10% | 10.1% | 9,033 | 9,092 |
| Active Idle | 0 | 0 | |
| Target Load | Actual Load | ssj_ops | |
|---|---|---|---|
| Target | Actual | ||
| Calibration 1 | 82,847 | ||
| Calibration 2 | 89,375 | ||
| Calibration 3 | 91,066 | ||
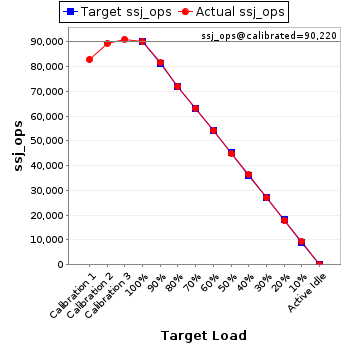
| ssj_ops@calibrated=90,220 | |||
| 100% | 99.9% | 90,220 | 90,095 |
| 90% | 90.4% | 81,198 | 81,580 |
| 80% | 79.9% | 72,176 | 72,050 |
| 70% | 70.1% | 63,154 | 63,234 |
| 60% | 60.1% | 54,132 | 54,196 |
| 50% | 49.8% | 45,110 | 44,931 |
| 40% | 40.3% | 36,088 | 36,359 |
| 30% | 29.9% | 27,066 | 26,954 |
| 20% | 19.7% | 18,044 | 17,798 |
| 10% | 10.4% | 9,022 | 9,379 |
| Active Idle | 0 | 0 | |
| Target Load | Actual Load | ssj_ops | |
|---|---|---|---|
| Target | Actual | ||
| Calibration 1 | 83,560 | ||
| Calibration 2 | 89,449 | ||
| Calibration 3 | 91,233 | ||
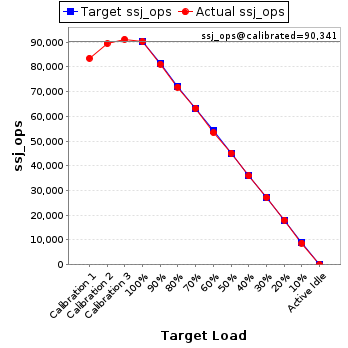
| ssj_ops@calibrated=90,341 | |||
| 100% | 100.1% | 90,341 | 90,407 |
| 90% | 89.8% | 81,307 | 81,115 |
| 80% | 79.6% | 72,273 | 71,874 |
| 70% | 70.1% | 63,239 | 63,310 |
| 60% | 59.1% | 54,205 | 53,435 |
| 50% | 49.9% | 45,171 | 45,083 |
| 40% | 39.7% | 36,136 | 35,888 |
| 30% | 30.1% | 27,102 | 27,226 |
| 20% | 20.0% | 18,068 | 18,053 |
| 10% | 9.7% | 9,034 | 8,721 |
| Active Idle | 0 | 0 | |
| Target Load | Actual Load | ssj_ops | |
|---|---|---|---|
| Target | Actual | ||
| Calibration 1 | 83,939 | ||
| Calibration 2 | 89,394 | ||
| Calibration 3 | 91,217 | ||
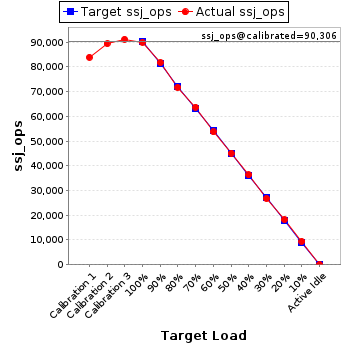
| ssj_ops@calibrated=90,306 | |||
| 100% | 99.7% | 90,306 | 90,041 |
| 90% | 90.6% | 81,275 | 81,788 |
| 80% | 79.4% | 72,244 | 71,722 |
| 70% | 70.6% | 63,214 | 63,762 |
| 60% | 59.5% | 54,183 | 53,691 |
| 50% | 49.9% | 45,153 | 45,062 |
| 40% | 40.2% | 36,122 | 36,346 |
| 30% | 29.6% | 27,092 | 26,762 |
| 20% | 20.2% | 18,061 | 18,258 |
| 10% | 10.4% | 9,031 | 9,429 |
| Active Idle | 0 | 0 | |
| Target Load | Actual Load | ssj_ops | |
|---|---|---|---|
| Target | Actual | ||
| Calibration 1 | 82,655 | ||
| Calibration 2 | 88,467 | ||
| Calibration 3 | 89,840 | ||
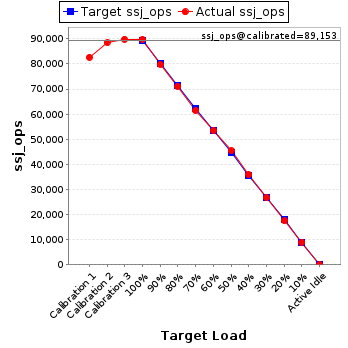
| ssj_ops@calibrated=89,153 | |||
| 100% | 100.7% | 89,153 | 89,798 |
| 90% | 89.5% | 80,238 | 79,787 |
| 80% | 79.7% | 71,323 | 71,023 |
| 70% | 68.8% | 62,407 | 61,372 |
| 60% | 59.9% | 53,492 | 53,415 |
| 50% | 51.0% | 44,577 | 45,436 |
| 40% | 40.3% | 35,661 | 35,916 |
| 30% | 30.0% | 26,746 | 26,710 |
| 20% | 19.6% | 17,831 | 17,457 |
| 10% | 10.0% | 8,915 | 8,950 |
| Active Idle | 0 | 0 | |
| Target Load | Actual Load | ssj_ops | |
|---|---|---|---|
| Target | Actual | ||
| Calibration 1 | 82,597 | ||
| Calibration 2 | 88,858 | ||
| Calibration 3 | 90,372 | ||
| ssj_ops@calibrated=89,615 | |||
| 100% | 99.3% | 89,615 | 88,975 |
| 90% | 89.4% | 80,654 | 80,123 |
| 80% | 79.8% | 71,692 | 71,533 |
| 70% | 71.2% | 62,731 | 63,782 |
| 60% | 59.9% | 53,769 | 53,645 |
| 50% | 50.0% | 44,808 | 44,838 |
| 40% | 40.0% | 35,846 | 35,879 |
| 30% | 30.2% | 26,885 | 27,078 |
| 20% | 20.6% | 17,923 | 18,467 |
| 10% | 10.3% | 8,962 | 9,208 |
| Active Idle | 0 | 0 | |
| Target Load | Actual Load | ssj_ops | |
|---|---|---|---|
| Target | Actual | ||
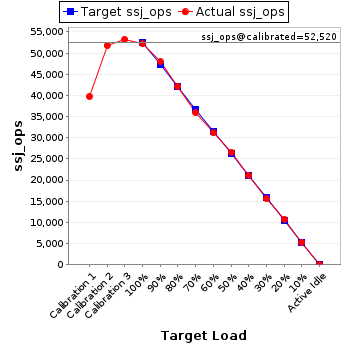
| Calibration 1 | 39,779 | ||
| Calibration 2 | 51,771 | ||
| Calibration 3 | 53,269 | ||
| ssj_ops@calibrated=52,520 | |||
| 100% | 99.4% | 52,520 | 52,185 |
| 90% | 91.4% | 47,268 | 48,003 |
| 80% | 80.3% | 42,016 | 42,169 |
| 70% | 68.4% | 36,764 | 35,921 |
| 60% | 59.3% | 31,512 | 31,121 |
| 50% | 50.5% | 26,260 | 26,546 |
| 40% | 40.3% | 21,008 | 21,175 |
| 30% | 29.7% | 15,756 | 15,603 |
| 20% | 20.5% | 10,504 | 10,750 |
| 10% | 10.0% | 5,252 | 5,271 |
| Active Idle | 0 | 0 | |
| Target Load | Actual Load | ssj_ops | |
|---|---|---|---|
| Target | Actual | ||
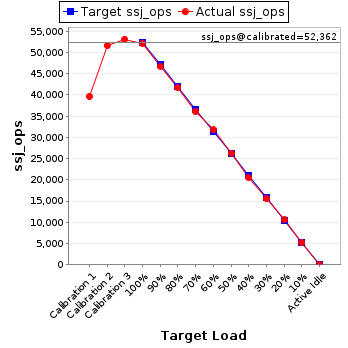
| Calibration 1 | 39,647 | ||
| Calibration 2 | 51,609 | ||
| Calibration 3 | 53,115 | ||
| ssj_ops@calibrated=52,362 | |||
| 100% | 99.6% | 52,362 | 52,160 |
| 90% | 89.3% | 47,126 | 46,771 |
| 80% | 79.7% | 41,890 | 41,719 |
| 70% | 68.9% | 36,654 | 36,088 |
| 60% | 60.6% | 31,417 | 31,737 |
| 50% | 50.2% | 26,181 | 26,308 |
| 40% | 39.2% | 20,945 | 20,551 |
| 30% | 29.7% | 15,709 | 15,529 |
| 20% | 20.1% | 10,472 | 10,544 |
| 10% | 9.9% | 5,236 | 5,158 |
| Active Idle | 0 | 0 | |
| Target Load | Actual Load | ssj_ops | |
|---|---|---|---|
| Target | Actual | ||
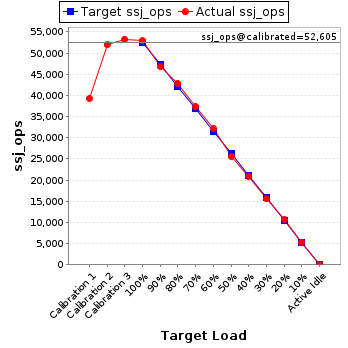
| Calibration 1 | 39,311 | ||
| Calibration 2 | 51,927 | ||
| Calibration 3 | 53,284 | ||
| ssj_ops@calibrated=52,605 | |||
| 100% | 100.7% | 52,605 | 52,951 |
| 90% | 88.9% | 47,345 | 46,770 |
| 80% | 81.5% | 42,084 | 42,848 |
| 70% | 71.1% | 36,824 | 37,400 |
| 60% | 61.0% | 31,563 | 32,110 |
| 50% | 48.6% | 26,303 | 25,574 |
| 40% | 39.8% | 21,042 | 20,953 |
| 30% | 29.5% | 15,782 | 15,534 |
| 20% | 20.1% | 10,521 | 10,571 |
| 10% | 10.0% | 5,261 | 5,275 |
| Active Idle | 0 | 0 | |
| Target Load | Actual Load | ssj_ops | |
|---|---|---|---|
| Target | Actual | ||
| Calibration 1 | 39,480 | ||
| Calibration 2 | 51,724 | ||
| Calibration 3 | 53,193 | ||
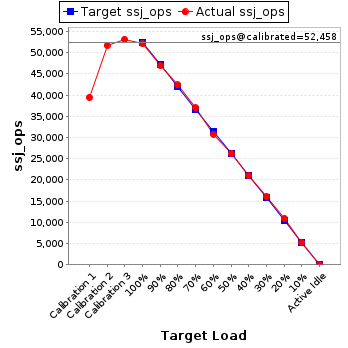
| ssj_ops@calibrated=52,458 | |||
| 100% | 99.5% | 52,458 | 52,199 |
| 90% | 89.6% | 47,213 | 47,001 |
| 80% | 80.8% | 41,967 | 42,410 |
| 70% | 70.5% | 36,721 | 36,980 |
| 60% | 58.7% | 31,475 | 30,794 |
| 50% | 49.9% | 26,229 | 26,196 |
| 40% | 40.1% | 20,983 | 21,025 |
| 30% | 30.6% | 15,738 | 16,067 |
| 20% | 20.7% | 10,492 | 10,879 |
| 10% | 9.9% | 5,246 | 5,196 |
| Active Idle | 0 | 0 | |
| Target Load | Actual Load | ssj_ops | |
|---|---|---|---|
| Target | Actual | ||
| Calibration 1 | 39,907 | ||
| Calibration 2 | 51,171 | ||
| Calibration 3 | 53,505 | ||
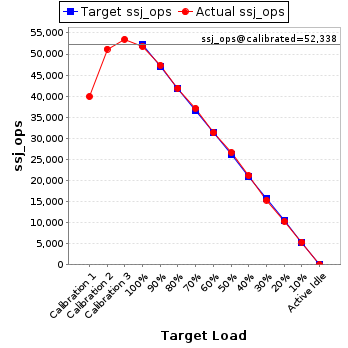
| ssj_ops@calibrated=52,338 | |||
| 100% | 98.9% | 52,338 | 51,788 |
| 90% | 90.4% | 47,105 | 47,339 |
| 80% | 80.0% | 41,871 | 41,897 |
| 70% | 71.0% | 36,637 | 37,144 |
| 60% | 59.8% | 31,403 | 31,323 |
| 50% | 50.9% | 26,169 | 26,648 |
| 40% | 40.4% | 20,935 | 21,149 |
| 30% | 29.3% | 15,702 | 15,325 |
| 20% | 19.6% | 10,468 | 10,270 |
| 10% | 10.2% | 5,234 | 5,362 |
| Active Idle | 0 | 0 | |
| Target Load | Actual Load | ssj_ops | |
|---|---|---|---|
| Target | Actual | ||
| Calibration 1 | 39,875 | ||
| Calibration 2 | 52,114 | ||
| Calibration 3 | 53,584 | ||
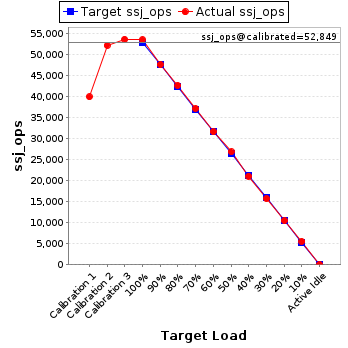
| ssj_ops@calibrated=52,849 | |||
| 100% | 101.1% | 52,849 | 53,442 |
| 90% | 90.0% | 47,564 | 47,546 |
| 80% | 80.6% | 42,279 | 42,617 |
| 70% | 70.2% | 36,994 | 37,122 |
| 60% | 59.8% | 31,709 | 31,600 |
| 50% | 50.7% | 26,424 | 26,819 |
| 40% | 39.8% | 21,140 | 21,033 |
| 30% | 29.7% | 15,855 | 15,686 |
| 20% | 19.8% | 10,570 | 10,454 |
| 10% | 10.5% | 5,285 | 5,525 |
| Active Idle | 0 | 0 | |
| Target Load | Actual Load | ssj_ops | |
|---|---|---|---|
| Target | Actual | ||
| Calibration 1 | 39,652 | ||
| Calibration 2 | 52,027 | ||
| Calibration 3 | 53,237 | ||
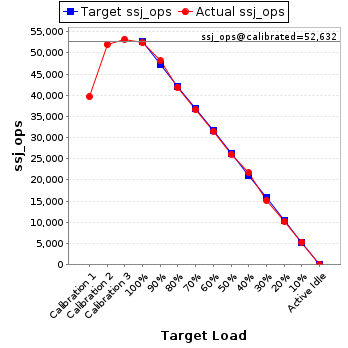
| ssj_ops@calibrated=52,632 | |||
| 100% | 99.6% | 52,632 | 52,431 |
| 90% | 91.5% | 47,369 | 48,150 |
| 80% | 79.6% | 42,106 | 41,911 |
| 70% | 69.5% | 36,842 | 36,566 |
| 60% | 59.8% | 31,579 | 31,484 |
| 50% | 49.5% | 26,316 | 26,046 |
| 40% | 41.2% | 21,053 | 21,687 |
| 30% | 28.9% | 15,790 | 15,192 |
| 20% | 19.4% | 10,526 | 10,192 |
| 10% | 10.1% | 5,263 | 5,333 |
| Active Idle | 0 | 0 | |
| Target Load | Actual Load | ssj_ops | |
|---|---|---|---|
| Target | Actual | ||
| Calibration 1 | 39,148 | ||
| Calibration 2 | 51,477 | ||
| Calibration 3 | 52,994 | ||
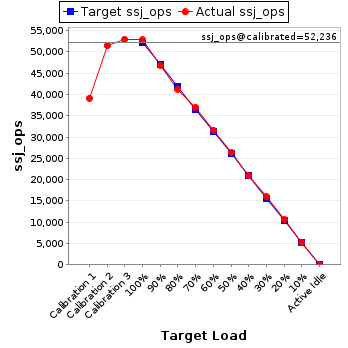
| ssj_ops@calibrated=52,236 | |||
| 100% | 101.1% | 52,236 | 52,823 |
| 90% | 89.7% | 47,012 | 46,851 |
| 80% | 79.0% | 41,789 | 41,264 |
| 70% | 70.7% | 36,565 | 36,948 |
| 60% | 60.6% | 31,341 | 31,650 |
| 50% | 50.5% | 26,118 | 26,374 |
| 40% | 40.1% | 20,894 | 20,969 |
| 30% | 30.5% | 15,671 | 15,912 |
| 20% | 20.2% | 10,447 | 10,550 |
| 10% | 9.9% | 5,224 | 5,146 |
| Active Idle | 0 | 0 | |
| Target Load | Actual Load | ssj_ops | |
|---|---|---|---|
| Target | Actual | ||
| Calibration 1 | 9,229 | ||
| Calibration 2 | 14,698 | ||
| Calibration 3 | 18,847 | ||
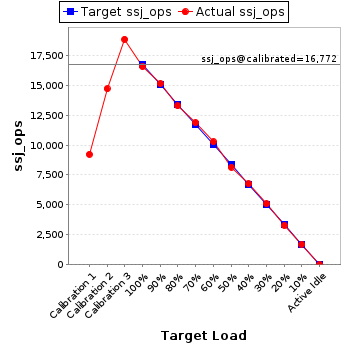
| ssj_ops@calibrated=16,772 | |||
| 100% | 98.8% | 16,772 | 16,565 |
| 90% | 90.3% | 15,095 | 15,146 |
| 80% | 79.2% | 13,418 | 13,279 |
| 70% | 70.8% | 11,740 | 11,867 |
| 60% | 61.2% | 10,063 | 10,271 |
| 50% | 48.6% | 8,386 | 8,147 |
| 40% | 40.2% | 6,709 | 6,750 |
| 30% | 30.3% | 5,032 | 5,087 |
| 20% | 19.5% | 3,354 | 3,275 |
| 10% | 10.2% | 1,677 | 1,708 |
| Active Idle | 0 | 0 | |
| Target Load | Actual Load | ssj_ops | |
|---|---|---|---|
| Target | Actual | ||
| Calibration 1 | 9,090 | ||
| Calibration 2 | 14,669 | ||
| Calibration 3 | 18,745 | ||
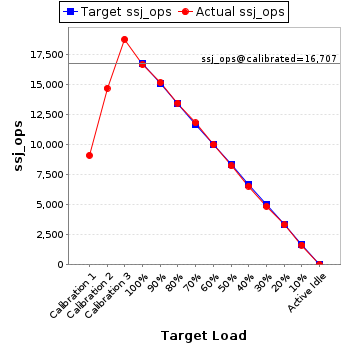
| ssj_ops@calibrated=16,707 | |||
| 100% | 99.6% | 16,707 | 16,637 |
| 90% | 90.6% | 15,036 | 15,137 |
| 80% | 80.4% | 13,365 | 13,440 |
| 70% | 70.5% | 11,695 | 11,783 |
| 60% | 59.7% | 10,024 | 9,967 |
| 50% | 49.2% | 8,353 | 8,213 |
| 40% | 39.1% | 6,683 | 6,529 |
| 30% | 29.1% | 5,012 | 4,854 |
| 20% | 19.8% | 3,341 | 3,303 |
| 10% | 9.8% | 1,671 | 1,629 |
| Active Idle | 0 | 0 | |