SPECpower_ssj2008
Host 'perf-2' Performance Report
Copyright © 2007-2025 Standard Performance Evaluation Corporation
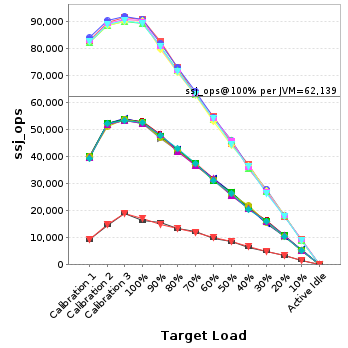
| Lenovo Global Technology ThinkEdge SE100 | ssj_ops@100% = 994,218 ssj_ops@100% per JVM = 62,139 |
||||
| Test Sponsor: | Lenovo Global Technology | SPEC License #: | 9017 | Test Method: | Multi Node |
| Tested By: | Lenovo Global Technology | Test Location: | Beijing, China | Test Date: | Sep 1, 2025 |
| Hardware Availability: | May-2025 | Software Availability: | Feb-2025 | Publication: | Sep 26, 2025 |
| System Source: | Single Supplier | System Designation: | Server | Power Provisioning: | Line-powered |
| Target Load | Actual Load | ssj_ops | |
|---|---|---|---|
| Target | Actual | ||
| Calibration 1 | 832,085 | ||
| Calibration 2 | 978,986 | ||
| Calibration 3 | 1,009,601 | ||
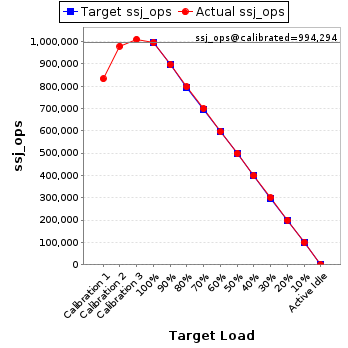
| ssj_ops@calibrated=994,294 | |||
| 100% | 100.0% | 994,294 | 994,218 |
| 90% | 90.1% | 894,864 | 895,403 |
| 80% | 80.1% | 795,435 | 796,615 |
| 70% | 70.3% | 696,006 | 699,246 |
| 60% | 59.9% | 596,576 | 595,659 |
| 50% | 50.1% | 497,147 | 497,960 |
| 40% | 40.1% | 397,718 | 398,462 |
| 30% | 30.2% | 298,288 | 299,916 |
| 20% | 20.0% | 198,859 | 199,169 |
| 10% | 10.1% | 99,429 | 100,196 |
| Active Idle | 0 | 0 | |
| Set Identifier: | sut |
| Set Description: | System Under Test |
| # of Identical Nodes: | 3 |
| Comment: | 'SUT' |
| Hardware | |
|---|---|
| Hardware Vendor: | Lenovo Global Technology |
| Model: | ThinkEdge SE100 |
| Form Factor: | 1U |
| CPU Name: | Intel Core Ultra 7 255H |
| CPU Characteristics: | 16 Core, 2.0GHz, 24MB L3 Cache |
| CPU Frequency (MHz): | 2000 |
| CPU(s) Enabled: | 16 cores, 1 chip, 16 cores/chip |
| Hardware Threads: | 16 (1 / core) |
| CPU(s) Orderable: | 1 chip |
| Primary Cache: | 64 KB I + 48 KB D on chip per core |
| Secondary Cache: | 3 MB I+D on chip per core |
| Tertiary Cache: | 24 MB I+D on chip per chip |
| Other Cache: | None |
| Memory Amount (GB): | 16 |
| # and size of DIMM: | 2 x 8192 MB |
| Memory Details: | 8GB 1Rx16 PC5-6400B; slots 1 and 2 populated |
| Power Supply Quantity and Rating (W): | None |
| Power Supply Details: | Shared |
| Disk Drive: | 1 x 240GB M.2 SSD P/N:4XB7A89422 |
| Disk Controller: | Integrated SATA controller |
| # and type of Network Interface Cards (NICs) Installed: | 1 x 1GbE RJ45 |
| NICs Enabled in Firmware / OS / Connected: | 4/4/1 |
| Network Speed (Mbit): | 1000 |
| Keyboard: | None |
| Mouse: | None |
| Monitor: | None |
| Optical Drives: | No |
| Other Hardware: | None |
| Software | |
|---|---|
| Power Management: | Enabled (see SUT Notes) |
| Operating System (OS): | Ubuntu 24.04.2 LTS 64-bit |
| OS Version: | Linux 6.8.0-60-generic |
| Filesystem: | ext4 |
| JVM Vendor: | Oracle Corporation |
| JVM Version: | Java HotSpot(TM) 64-Bit Server VM (build 17.0.10+11-LTS-240, mixed mode, sharing), version 17.0.10 |
| JVM Command-line Options: | -server -Xmn450m -Xms512m -Xmx512m -XX:ParallelGCThreads=2 -XX:+UseLargePages -XX:InlineSmallCode=1500 -XX:AutoBoxCacheMax=20000 -XX:+UseParallelGC -XX:FreqInlineSize=2500 -XX:CompileThresholdScaling=210 |
| JVM Affinity: | for each physicalCore { numactl -C physicalCoreId } |
| JVM Instances: | 16 |
| JVM Initial Heap (MB): | 512 |
| JVM Maximum Heap (MB): | 512 |
| JVM Address Bits: | 64 |
| Boot Firmware Version: | DZE104U |
| Management Firmware Version: | DZX310C |
| Workload Version: | SSJ 1.2.10 |
| Director Location: | Controller |
| Other Software: | None |
| JVM Instance | ssj_ops@100% |
|---|---|
| perf-2.001 | 90,631 |
| perf-2.002 | 90,778 |
| perf-2.003 | 89,100 |
| perf-2.004 | 90,120 |
| perf-2.005 | 90,126 |
| perf-2.006 | 89,245 |
| perf-2.007 | 52,860 |
| perf-2.008 | 52,215 |
| perf-2.009 | 52,990 |
| perf-2.010 | 52,597 |
| perf-2.011 | 52,687 |
| perf-2.012 | 52,579 |
| perf-2.013 | 52,274 |
| perf-2.014 | 52,540 |
| perf-2.015 | 16,316 |
| perf-2.016 | 17,160 |
| ssj_ops@100% | 994,218 |
| ssj_ops@100% per JVM | 62,139 |
| Target Load | Actual Load | ssj_ops | |
|---|---|---|---|
| Target | Actual | ||
| Calibration 1 | 82,989 | ||
| Calibration 2 | 89,465 | ||
| Calibration 3 | 91,456 | ||
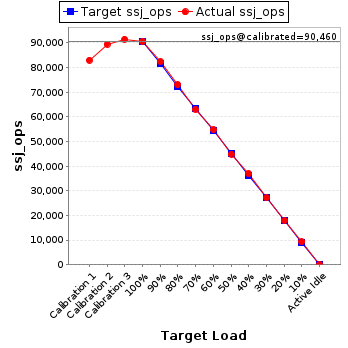
| ssj_ops@calibrated=90,460 | |||
| 100% | 100.2% | 90,460 | 90,631 |
| 90% | 91.1% | 81,414 | 82,422 |
| 80% | 80.7% | 72,368 | 73,026 |
| 70% | 69.7% | 63,322 | 63,032 |
| 60% | 60.5% | 54,276 | 54,692 |
| 50% | 49.6% | 45,230 | 44,868 |
| 40% | 40.8% | 36,184 | 36,917 |
| 30% | 29.9% | 27,138 | 27,071 |
| 20% | 19.8% | 18,092 | 17,904 |
| 10% | 10.3% | 9,046 | 9,309 |
| Active Idle | 0 | 0 | |
| Target Load | Actual Load | ssj_ops | |
|---|---|---|---|
| Target | Actual | ||
| Calibration 1 | 83,807 | ||
| Calibration 2 | 90,100 | ||
| Calibration 3 | 91,786 | ||
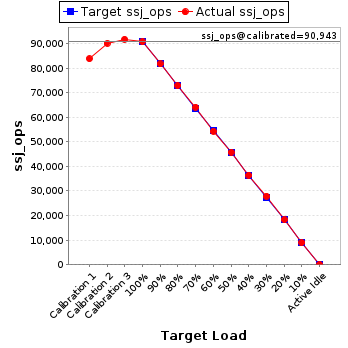
| ssj_ops@calibrated=90,943 | |||
| 100% | 99.8% | 90,943 | 90,778 |
| 90% | 89.8% | 81,849 | 81,705 |
| 80% | 80.2% | 72,754 | 72,904 |
| 70% | 70.6% | 63,660 | 64,174 |
| 60% | 59.7% | 54,566 | 54,319 |
| 50% | 50.4% | 45,471 | 45,798 |
| 40% | 40.1% | 36,377 | 36,463 |
| 30% | 30.7% | 27,283 | 27,917 |
| 20% | 20.1% | 18,189 | 18,304 |
| 10% | 9.9% | 9,094 | 8,983 |
| Active Idle | 0 | 0 | |
| Target Load | Actual Load | ssj_ops | |
|---|---|---|---|
| Target | Actual | ||
| Calibration 1 | 82,322 | ||
| Calibration 2 | 88,535 | ||
| Calibration 3 | 89,893 | ||
| ssj_ops@calibrated=89,214 | |||
| 100% | 99.9% | 89,214 | 89,100 |
| 90% | 90.3% | 80,293 | 80,556 |
| 80% | 80.6% | 71,371 | 71,948 |
| 70% | 70.4% | 62,450 | 62,768 |
| 60% | 60.3% | 53,529 | 53,829 |
| 50% | 51.4% | 44,607 | 45,894 |
| 40% | 39.9% | 35,686 | 35,554 |
| 30% | 30.5% | 26,764 | 27,187 |
| 20% | 20.3% | 17,843 | 18,137 |
| 10% | 10.2% | 8,921 | 9,075 |
| Active Idle | 0 | 0 | |

| Target Load | Actual Load | ssj_ops | |
|---|---|---|---|
| Target | Actual | ||
| Calibration 1 | 82,349 | ||
| Calibration 2 | 88,460 | ||
| Calibration 3 | 89,999 | ||
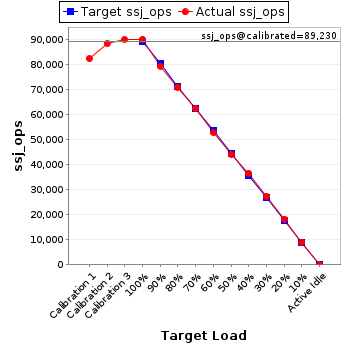
| ssj_ops@calibrated=89,230 | |||
| 100% | 101.0% | 89,230 | 90,120 |
| 90% | 89.0% | 80,307 | 79,412 |
| 80% | 79.6% | 71,384 | 70,997 |
| 70% | 70.2% | 62,461 | 62,611 |
| 60% | 59.2% | 53,538 | 52,825 |
| 50% | 49.5% | 44,615 | 44,183 |
| 40% | 41.0% | 35,692 | 36,556 |
| 30% | 30.6% | 26,769 | 27,316 |
| 20% | 20.4% | 17,846 | 18,237 |
| 10% | 10.1% | 8,923 | 8,987 |
| Active Idle | 0 | 0 | |
| Target Load | Actual Load | ssj_ops | |
|---|---|---|---|
| Target | Actual | ||
| Calibration 1 | 82,578 | ||
| Calibration 2 | 89,096 | ||
| Calibration 3 | 90,755 | ||
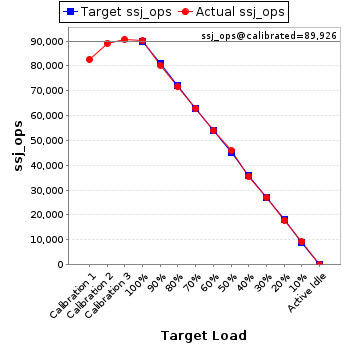
| ssj_ops@calibrated=89,926 | |||
| 100% | 100.2% | 89,926 | 90,126 |
| 90% | 89.4% | 80,933 | 80,370 |
| 80% | 79.6% | 71,941 | 71,587 |
| 70% | 69.9% | 62,948 | 62,898 |
| 60% | 60.0% | 53,955 | 53,912 |
| 50% | 51.1% | 44,963 | 45,925 |
| 40% | 39.7% | 35,970 | 35,668 |
| 30% | 30.2% | 26,978 | 27,114 |
| 20% | 19.9% | 17,985 | 17,916 |
| 10% | 10.3% | 8,993 | 9,222 |
| Active Idle | 0 | 0 | |
| Target Load | Actual Load | ssj_ops | |
|---|---|---|---|
| Target | Actual | ||
| Calibration 1 | 82,422 | ||
| Calibration 2 | 88,704 | ||
| Calibration 3 | 90,111 | ||
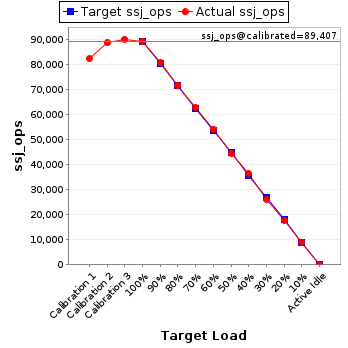
| ssj_ops@calibrated=89,407 | |||
| 100% | 99.8% | 89,407 | 89,245 |
| 90% | 90.3% | 80,467 | 80,750 |
| 80% | 80.0% | 71,526 | 71,556 |
| 70% | 70.2% | 62,585 | 62,736 |
| 60% | 60.6% | 53,644 | 54,204 |
| 50% | 49.9% | 44,704 | 44,579 |
| 40% | 40.7% | 35,763 | 36,412 |
| 30% | 29.3% | 26,822 | 26,203 |
| 20% | 19.8% | 17,881 | 17,742 |
| 10% | 10.1% | 8,941 | 9,029 |
| Active Idle | 0 | 0 | |
| Target Load | Actual Load | ssj_ops | |
|---|---|---|---|
| Target | Actual | ||
| Calibration 1 | 39,636 | ||
| Calibration 2 | 51,905 | ||
| Calibration 3 | 53,362 | ||
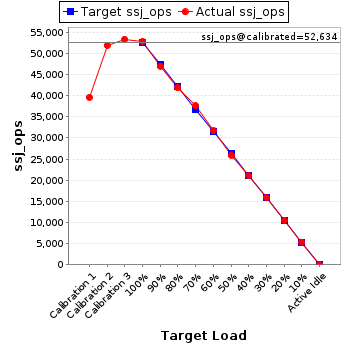
| ssj_ops@calibrated=52,634 | |||
| 100% | 100.4% | 52,634 | 52,860 |
| 90% | 89.3% | 47,370 | 47,009 |
| 80% | 79.7% | 42,107 | 41,923 |
| 70% | 71.5% | 36,843 | 37,627 |
| 60% | 60.2% | 31,580 | 31,706 |
| 50% | 49.3% | 26,317 | 25,946 |
| 40% | 40.0% | 21,053 | 21,047 |
| 30% | 30.1% | 15,790 | 15,853 |
| 20% | 19.9% | 10,527 | 10,471 |
| 10% | 10.2% | 5,263 | 5,360 |
| Active Idle | 0 | 0 | |
| Target Load | Actual Load | ssj_ops | |
|---|---|---|---|
| Target | Actual | ||
| Calibration 1 | 39,558 | ||
| Calibration 2 | 51,747 | ||
| Calibration 3 | 53,259 | ||
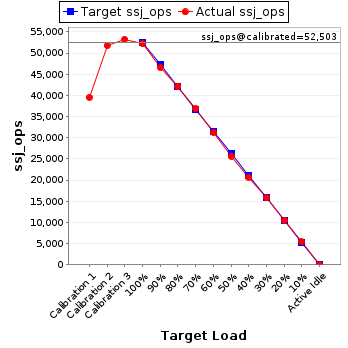
| ssj_ops@calibrated=52,503 | |||
| 100% | 99.5% | 52,503 | 52,215 |
| 90% | 88.7% | 47,252 | 46,557 |
| 80% | 80.3% | 42,002 | 42,162 |
| 70% | 70.2% | 36,752 | 36,852 |
| 60% | 59.6% | 31,502 | 31,271 |
| 50% | 48.8% | 26,251 | 25,608 |
| 40% | 39.4% | 21,001 | 20,676 |
| 30% | 30.1% | 15,751 | 15,795 |
| 20% | 20.0% | 10,501 | 10,475 |
| 10% | 10.2% | 5,250 | 5,371 |
| Active Idle | 0 | 0 | |
| Target Load | Actual Load | ssj_ops | |
|---|---|---|---|
| Target | Actual | ||
| Calibration 1 | 39,618 | ||
| Calibration 2 | 52,029 | ||
| Calibration 3 | 53,536 | ||
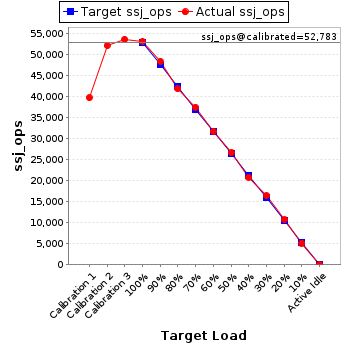
| ssj_ops@calibrated=52,783 | |||
| 100% | 100.4% | 52,783 | 52,990 |
| 90% | 91.5% | 47,504 | 48,302 |
| 80% | 79.1% | 42,226 | 41,763 |
| 70% | 70.9% | 36,948 | 37,413 |
| 60% | 60.0% | 31,670 | 31,667 |
| 50% | 50.3% | 26,391 | 26,575 |
| 40% | 39.3% | 21,113 | 20,741 |
| 30% | 31.0% | 15,835 | 16,375 |
| 20% | 20.2% | 10,557 | 10,687 |
| 10% | 9.7% | 5,278 | 5,133 |
| Active Idle | 0 | 0 | |
| Target Load | Actual Load | ssj_ops | |
|---|---|---|---|
| Target | Actual | ||
| Calibration 1 | 39,877 | ||
| Calibration 2 | 52,309 | ||
| Calibration 3 | 53,896 | ||
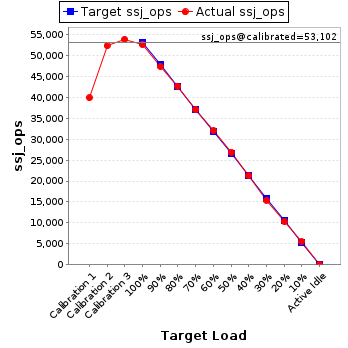
| ssj_ops@calibrated=53,102 | |||
| 100% | 99.0% | 53,102 | 52,597 |
| 90% | 89.2% | 47,792 | 47,366 |
| 80% | 80.3% | 42,482 | 42,653 |
| 70% | 69.8% | 37,172 | 37,062 |
| 60% | 60.3% | 31,861 | 32,000 |
| 50% | 50.6% | 26,551 | 26,861 |
| 40% | 40.0% | 21,241 | 21,260 |
| 30% | 29.0% | 15,931 | 15,401 |
| 20% | 19.3% | 10,620 | 10,267 |
| 10% | 10.4% | 5,310 | 5,500 |
| Active Idle | 0 | 0 | |
| Target Load | Actual Load | ssj_ops | |
|---|---|---|---|
| Target | Actual | ||
| Calibration 1 | 39,810 | ||
| Calibration 2 | 52,071 | ||
| Calibration 3 | 53,579 | ||
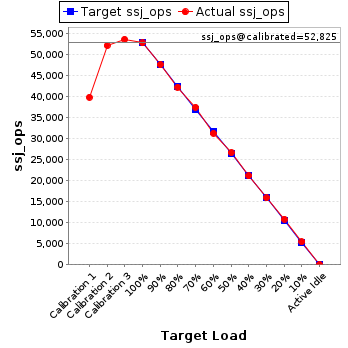
| ssj_ops@calibrated=52,825 | |||
| 100% | 99.7% | 52,825 | 52,687 |
| 90% | 90.0% | 47,543 | 47,531 |
| 80% | 79.9% | 42,260 | 42,194 |
| 70% | 70.8% | 36,978 | 37,417 |
| 60% | 59.1% | 31,695 | 31,232 |
| 50% | 50.4% | 26,413 | 26,634 |
| 40% | 39.9% | 21,130 | 21,100 |
| 30% | 30.0% | 15,848 | 15,846 |
| 20% | 20.5% | 10,565 | 10,837 |
| 10% | 10.2% | 5,283 | 5,412 |
| Active Idle | 0 | 0 | |
| Target Load | Actual Load | ssj_ops | |
|---|---|---|---|
| Target | Actual | ||
| Calibration 1 | 39,861 | ||
| Calibration 2 | 51,199 | ||
| Calibration 3 | 53,511 | ||
| ssj_ops@calibrated=52,355 | |||
| 100% | 100.4% | 52,355 | 52,579 |
| 90% | 90.1% | 47,119 | 47,174 |
| 80% | 81.0% | 41,884 | 42,395 |
| 70% | 70.1% | 36,648 | 36,689 |
| 60% | 59.8% | 31,413 | 31,322 |
| 50% | 49.8% | 26,177 | 26,080 |
| 40% | 41.5% | 20,942 | 21,750 |
| 30% | 30.1% | 15,706 | 15,761 |
| 20% | 20.1% | 10,471 | 10,533 |
| 10% | 10.0% | 5,235 | 5,215 |
| Active Idle | 0 | 0 | |

| Target Load | Actual Load | ssj_ops | |
|---|---|---|---|
| Target | Actual | ||
| Calibration 1 | 39,489 | ||
| Calibration 2 | 51,869 | ||
| Calibration 3 | 53,264 | ||
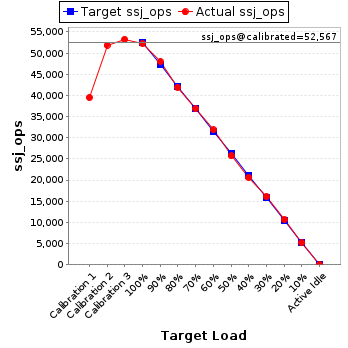
| ssj_ops@calibrated=52,567 | |||
| 100% | 99.4% | 52,567 | 52,274 |
| 90% | 91.3% | 47,310 | 48,010 |
| 80% | 79.7% | 42,053 | 41,899 |
| 70% | 70.0% | 36,797 | 36,793 |
| 60% | 60.6% | 31,540 | 31,839 |
| 50% | 48.9% | 26,283 | 25,698 |
| 40% | 39.2% | 21,027 | 20,623 |
| 30% | 30.5% | 15,770 | 16,058 |
| 20% | 20.3% | 10,513 | 10,654 |
| 10% | 9.8% | 5,257 | 5,138 |
| Active Idle | 0 | 0 | |
| Target Load | Actual Load | ssj_ops | |
|---|---|---|---|
| Target | Actual | ||
| Calibration 1 | 39,344 | ||
| Calibration 2 | 52,092 | ||
| Calibration 3 | 53,269 | ||
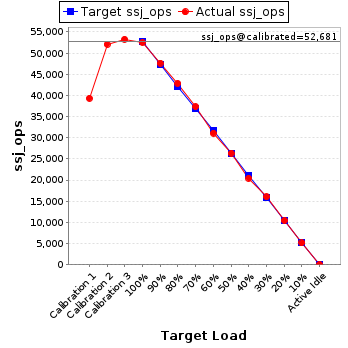
| ssj_ops@calibrated=52,681 | |||
| 100% | 99.7% | 52,681 | 52,540 |
| 90% | 90.4% | 47,413 | 47,649 |
| 80% | 81.3% | 42,145 | 42,849 |
| 70% | 70.9% | 36,877 | 37,328 |
| 60% | 59.0% | 31,608 | 31,096 |
| 50% | 50.0% | 26,340 | 26,325 |
| 40% | 38.8% | 21,072 | 20,442 |
| 30% | 30.4% | 15,804 | 16,017 |
| 20% | 19.8% | 10,536 | 10,444 |
| 10% | 9.8% | 5,268 | 5,144 |
| Active Idle | 0 | 0 | |
| Target Load | Actual Load | ssj_ops | |
|---|---|---|---|
| Target | Actual | ||
| Calibration 1 | 9,275 | ||
| Calibration 2 | 14,642 | ||
| Calibration 3 | 18,968 | ||
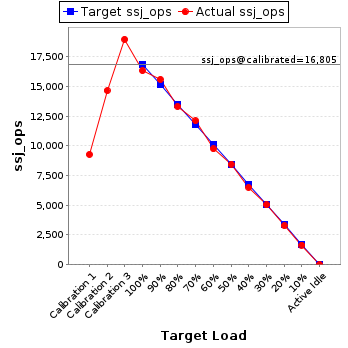
| ssj_ops@calibrated=16,805 | |||
| 100% | 97.1% | 16,805 | 16,316 |
| 90% | 92.8% | 15,125 | 15,593 |
| 80% | 79.2% | 13,444 | 13,306 |
| 70% | 72.0% | 11,764 | 12,099 |
| 60% | 57.9% | 10,083 | 9,734 |
| 50% | 50.3% | 8,403 | 8,447 |
| 40% | 38.7% | 6,722 | 6,504 |
| 30% | 29.9% | 5,042 | 5,028 |
| 20% | 19.5% | 3,361 | 3,270 |
| 10% | 9.8% | 1,681 | 1,654 |
| Active Idle | 0 | 0 | |
| Target Load | Actual Load | ssj_ops | |
|---|---|---|---|
| Target | Actual | ||
| Calibration 1 | 9,151 | ||
| Calibration 2 | 14,764 | ||
| Calibration 3 | 18,956 | ||
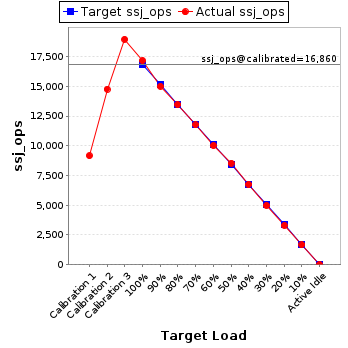
| ssj_ops@calibrated=16,860 | |||
| 100% | 101.8% | 16,860 | 17,160 |
| 90% | 89.0% | 15,174 | 14,998 |
| 80% | 79.8% | 13,488 | 13,452 |
| 70% | 69.7% | 11,802 | 11,746 |
| 60% | 59.4% | 10,116 | 10,010 |
| 50% | 50.6% | 8,430 | 8,537 |
| 40% | 40.0% | 6,744 | 6,750 |
| 30% | 29.5% | 5,058 | 4,975 |
| 20% | 19.5% | 3,372 | 3,290 |
| 10% | 9.9% | 1,686 | 1,662 |
| Active Idle | 0 | 0 | |