SPECpower_ssj2008
Host 'perf-3' Performance Report
Copyright © 2007-2025 Standard Performance Evaluation Corporation
| Lenovo Global Technology ThinkEdge SE100 | ssj_ops@100% = 997,195 ssj_ops@100% per JVM = 62,325 |
||||
| Test Sponsor: | Lenovo Global Technology | SPEC License #: | 9017 | Test Method: | Multi Node |
| Tested By: | Lenovo Global Technology | Test Location: | Beijing, China | Test Date: | Sep 1, 2025 |
| Hardware Availability: | May-2025 | Software Availability: | Feb-2025 | Publication: | Sep 26, 2025 |
| System Source: | Single Supplier | System Designation: | Server | Power Provisioning: | Line-powered |
| Target Load | Actual Load | ssj_ops | |
|---|---|---|---|
| Target | Actual | ||
| Calibration 1 | 835,077 | ||
| Calibration 2 | 981,899 | ||
| Calibration 3 | 1,011,780 | ||
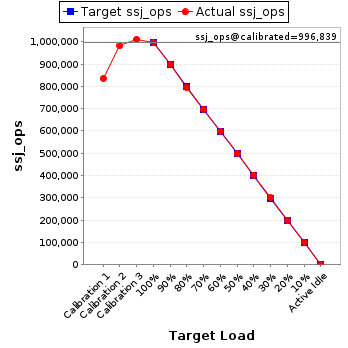
| ssj_ops@calibrated=996,839 | |||
| 100% | 100.0% | 996,839 | 997,195 |
| 90% | 90.0% | 897,156 | 897,464 |
| 80% | 80.0% | 797,472 | 797,088 |
| 70% | 70.1% | 697,788 | 698,307 |
| 60% | 60.1% | 598,104 | 598,798 |
| 50% | 50.0% | 498,420 | 498,652 |
| 40% | 40.2% | 398,736 | 401,134 |
| 30% | 30.0% | 299,052 | 299,496 |
| 20% | 19.9% | 199,368 | 198,623 |
| 10% | 10.0% | 99,684 | 100,171 |
| Active Idle | 0 | 0 | |
| Set Identifier: | sut |
| Set Description: | System Under Test |
| # of Identical Nodes: | 3 |
| Comment: | 'SUT' |
| Hardware | |
|---|---|
| Hardware Vendor: | Lenovo Global Technology |
| Model: | ThinkEdge SE100 |
| Form Factor: | 1U |
| CPU Name: | Intel Core Ultra 7 255H |
| CPU Characteristics: | 16 Core, 2.0GHz, 24MB L3 Cache |
| CPU Frequency (MHz): | 2000 |
| CPU(s) Enabled: | 16 cores, 1 chip, 16 cores/chip |
| Hardware Threads: | 16 (1 / core) |
| CPU(s) Orderable: | 1 chip |
| Primary Cache: | 64 KB I + 48 KB D on chip per core |
| Secondary Cache: | 3 MB I+D on chip per core |
| Tertiary Cache: | 24 MB I+D on chip per chip |
| Other Cache: | None |
| Memory Amount (GB): | 16 |
| # and size of DIMM: | 2 x 8192 MB |
| Memory Details: | 8GB 1Rx16 PC5-6400B; slots 1 and 2 populated |
| Power Supply Quantity and Rating (W): | None |
| Power Supply Details: | Shared |
| Disk Drive: | 1 x 240GB M.2 SSD P/N:4XB7A89422 |
| Disk Controller: | Integrated SATA controller |
| # and type of Network Interface Cards (NICs) Installed: | 1 x 1GbE RJ45 |
| NICs Enabled in Firmware / OS / Connected: | 4/4/1 |
| Network Speed (Mbit): | 1000 |
| Keyboard: | None |
| Mouse: | None |
| Monitor: | None |
| Optical Drives: | No |
| Other Hardware: | None |
| Software | |
|---|---|
| Power Management: | Enabled (see SUT Notes) |
| Operating System (OS): | Ubuntu 24.04.2 LTS 64-bit |
| OS Version: | Linux 6.8.0-60-generic |
| Filesystem: | ext4 |
| JVM Vendor: | Oracle Corporation |
| JVM Version: | Java HotSpot(TM) 64-Bit Server VM (build 17.0.10+11-LTS-240, mixed mode, sharing), version 17.0.10 |
| JVM Command-line Options: | -server -Xmn450m -Xms512m -Xmx512m -XX:ParallelGCThreads=2 -XX:+UseLargePages -XX:InlineSmallCode=1500 -XX:AutoBoxCacheMax=20000 -XX:+UseParallelGC -XX:FreqInlineSize=2500 -XX:CompileThresholdScaling=210 |
| JVM Affinity: | for each physicalCore { numactl -C physicalCoreId } |
| JVM Instances: | 16 |
| JVM Initial Heap (MB): | 512 |
| JVM Maximum Heap (MB): | 512 |
| JVM Address Bits: | 64 |
| Boot Firmware Version: | DZE104U |
| Management Firmware Version: | DZX310C |
| Workload Version: | SSJ 1.2.10 |
| Director Location: | Controller |
| Other Software: | None |
| JVM Instance | ssj_ops@100% |
|---|---|
| perf-3.001 | 89,494 |
| perf-3.002 | 90,817 |
| perf-3.003 | 90,556 |
| perf-3.004 | 90,508 |
| perf-3.005 | 89,700 |
| perf-3.006 | 89,506 |
| perf-3.007 | 51,996 |
| perf-3.008 | 52,798 |
| perf-3.009 | 52,750 |
| perf-3.010 | 52,655 |
| perf-3.011 | 52,951 |
| perf-3.012 | 53,391 |
| perf-3.013 | 52,784 |
| perf-3.014 | 53,510 |
| perf-3.015 | 17,382 |
| perf-3.016 | 16,397 |
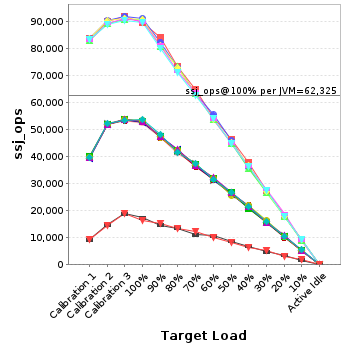
| ssj_ops@100% | 997,195 |
| ssj_ops@100% per JVM | 62,325 |
| Target Load | Actual Load | ssj_ops | |
|---|---|---|---|
| Target | Actual | ||
| Calibration 1 | 83,662 | ||
| Calibration 2 | 89,971 | ||
| Calibration 3 | 91,715 | ||
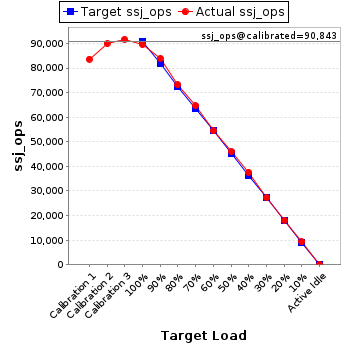
| ssj_ops@calibrated=90,843 | |||
| 100% | 98.5% | 90,843 | 89,494 |
| 90% | 92.4% | 81,759 | 83,937 |
| 80% | 80.6% | 72,675 | 73,223 |
| 70% | 71.2% | 63,590 | 64,687 |
| 60% | 59.9% | 54,506 | 54,426 |
| 50% | 50.7% | 45,422 | 46,067 |
| 40% | 41.4% | 36,337 | 37,567 |
| 30% | 30.0% | 27,253 | 27,279 |
| 20% | 19.9% | 18,169 | 18,096 |
| 10% | 10.2% | 9,084 | 9,242 |
| Active Idle | 0 | 0 | |
| Target Load | Actual Load | ssj_ops | |
|---|---|---|---|
| Target | Actual | ||
| Calibration 1 | 83,545 | ||
| Calibration 2 | 90,251 | ||
| Calibration 3 | 91,601 | ||
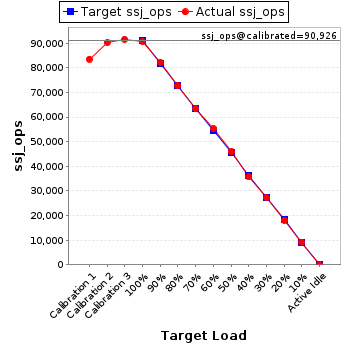
| ssj_ops@calibrated=90,926 | |||
| 100% | 99.9% | 90,926 | 90,817 |
| 90% | 90.5% | 81,833 | 82,257 |
| 80% | 80.0% | 72,741 | 72,724 |
| 70% | 69.7% | 63,648 | 63,370 |
| 60% | 60.8% | 54,556 | 55,308 |
| 50% | 50.4% | 45,463 | 45,838 |
| 40% | 39.3% | 36,370 | 35,727 |
| 30% | 30.1% | 27,278 | 27,357 |
| 20% | 19.8% | 18,185 | 17,958 |
| 10% | 10.1% | 9,093 | 9,159 |
| Active Idle | 0 | 0 | |
| Target Load | Actual Load | ssj_ops | |
|---|---|---|---|
| Target | Actual | ||
| Calibration 1 | 82,994 | ||
| Calibration 2 | 89,122 | ||
| Calibration 3 | 90,619 | ||
| ssj_ops@calibrated=89,871 | |||
| 100% | 100.8% | 89,871 | 90,556 |
| 90% | 89.8% | 80,884 | 80,674 |
| 80% | 81.4% | 71,897 | 73,131 |
| 70% | 70.3% | 62,910 | 63,142 |
| 60% | 59.9% | 53,922 | 53,792 |
| 50% | 50.0% | 44,935 | 44,944 |
| 40% | 39.5% | 35,948 | 35,471 |
| 30% | 29.8% | 26,961 | 26,740 |
| 20% | 19.9% | 17,974 | 17,925 |
| 10% | 10.0% | 8,987 | 8,996 |
| Active Idle | 0 | 0 | |

| Target Load | Actual Load | ssj_ops | |
|---|---|---|---|
| Target | Actual | ||
| Calibration 1 | 83,690 | ||
| Calibration 2 | 90,038 | ||
| Calibration 3 | 91,109 | ||
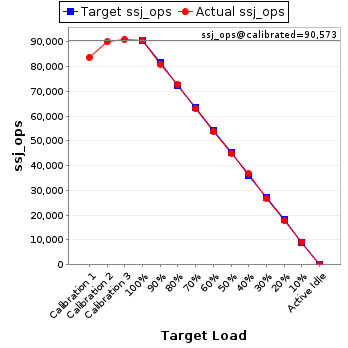
| ssj_ops@calibrated=90,573 | |||
| 100% | 99.9% | 90,573 | 90,508 |
| 90% | 89.5% | 81,516 | 81,062 |
| 80% | 80.2% | 72,459 | 72,674 |
| 70% | 69.7% | 63,401 | 63,104 |
| 60% | 59.4% | 54,344 | 53,788 |
| 50% | 49.7% | 45,287 | 45,039 |
| 40% | 40.6% | 36,229 | 36,768 |
| 30% | 29.7% | 27,172 | 26,926 |
| 20% | 19.5% | 18,115 | 17,695 |
| 10% | 10.1% | 9,057 | 9,137 |
| Active Idle | 0 | 0 | |
| Target Load | Actual Load | ssj_ops | |
|---|---|---|---|
| Target | Actual | ||
| Calibration 1 | 82,864 | ||
| Calibration 2 | 89,194 | ||
| Calibration 3 | 90,808 | ||
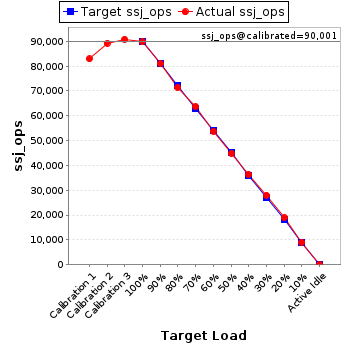
| ssj_ops@calibrated=90,001 | |||
| 100% | 99.7% | 90,001 | 89,700 |
| 90% | 90.1% | 81,001 | 81,061 |
| 80% | 79.3% | 72,001 | 71,371 |
| 70% | 70.8% | 63,001 | 63,685 |
| 60% | 59.7% | 54,000 | 53,703 |
| 50% | 49.8% | 45,000 | 44,813 |
| 40% | 40.4% | 36,000 | 36,401 |
| 30% | 31.0% | 27,000 | 27,942 |
| 20% | 21.0% | 18,000 | 18,896 |
| 10% | 10.0% | 9,000 | 9,021 |
| Active Idle | 0 | 0 | |
| Target Load | Actual Load | ssj_ops | |
|---|---|---|---|
| Target | Actual | ||
| Calibration 1 | 83,037 | ||
| Calibration 2 | 88,832 | ||
| Calibration 3 | 90,375 | ||
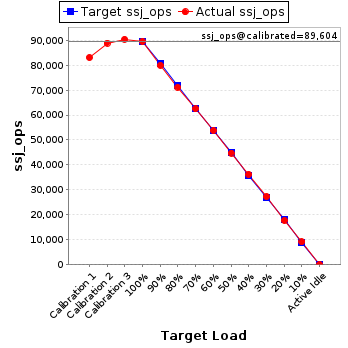
| ssj_ops@calibrated=89,604 | |||
| 100% | 99.9% | 89,604 | 89,506 |
| 90% | 89.2% | 80,643 | 79,921 |
| 80% | 79.4% | 71,683 | 71,119 |
| 70% | 69.7% | 62,722 | 62,454 |
| 60% | 60.1% | 53,762 | 53,840 |
| 50% | 50.0% | 44,802 | 44,758 |
| 40% | 40.5% | 35,841 | 36,268 |
| 30% | 30.5% | 26,881 | 27,317 |
| 20% | 19.7% | 17,921 | 17,696 |
| 10% | 10.2% | 8,960 | 9,133 |
| Active Idle | 0 | 0 | |
| Target Load | Actual Load | ssj_ops | |
|---|---|---|---|
| Target | Actual | ||
| Calibration 1 | 39,375 | ||
| Calibration 2 | 51,687 | ||
| Calibration 3 | 53,373 | ||
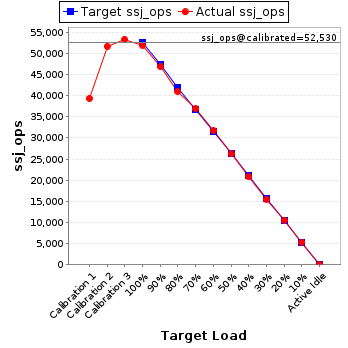
| ssj_ops@calibrated=52,530 | |||
| 100% | 99.0% | 52,530 | 51,996 |
| 90% | 89.3% | 47,277 | 46,902 |
| 80% | 78.0% | 42,024 | 40,984 |
| 70% | 70.2% | 36,771 | 36,876 |
| 60% | 60.3% | 31,518 | 31,700 |
| 50% | 49.9% | 26,265 | 26,204 |
| 40% | 39.7% | 21,012 | 20,838 |
| 30% | 29.6% | 15,759 | 15,542 |
| 20% | 20.1% | 10,506 | 10,565 |
| 10% | 10.2% | 5,253 | 5,342 |
| Active Idle | 0 | 0 | |
| Target Load | Actual Load | ssj_ops | |
|---|---|---|---|
| Target | Actual | ||
| Calibration 1 | 39,870 | ||
| Calibration 2 | 52,129 | ||
| Calibration 3 | 53,522 | ||
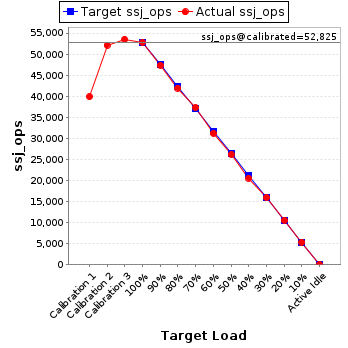
| ssj_ops@calibrated=52,825 | |||
| 100% | 99.9% | 52,825 | 52,798 |
| 90% | 89.6% | 47,543 | 47,328 |
| 80% | 79.4% | 42,260 | 41,933 |
| 70% | 70.6% | 36,978 | 37,317 |
| 60% | 59.1% | 31,695 | 31,208 |
| 50% | 49.5% | 26,413 | 26,129 |
| 40% | 38.9% | 21,130 | 20,567 |
| 30% | 30.2% | 15,848 | 15,954 |
| 20% | 20.1% | 10,565 | 10,594 |
| 10% | 10.1% | 5,283 | 5,346 |
| Active Idle | 0 | 0 | |
| Target Load | Actual Load | ssj_ops | |
|---|---|---|---|
| Target | Actual | ||
| Calibration 1 | 39,662 | ||
| Calibration 2 | 51,778 | ||
| Calibration 3 | 53,415 | ||
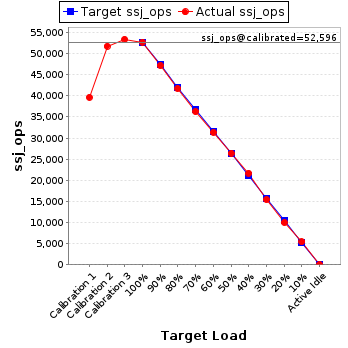
| ssj_ops@calibrated=52,596 | |||
| 100% | 100.3% | 52,596 | 52,750 |
| 90% | 89.6% | 47,337 | 47,145 |
| 80% | 79.4% | 42,077 | 41,747 |
| 70% | 68.9% | 36,817 | 36,262 |
| 60% | 59.6% | 31,558 | 31,362 |
| 50% | 50.2% | 26,298 | 26,392 |
| 40% | 41.2% | 21,039 | 21,682 |
| 30% | 29.3% | 15,779 | 15,400 |
| 20% | 19.0% | 10,519 | 9,987 |
| 10% | 10.3% | 5,260 | 5,408 |
| Active Idle | 0 | 0 | |
| Target Load | Actual Load | ssj_ops | |
|---|---|---|---|
| Target | Actual | ||
| Calibration 1 | 39,269 | ||
| Calibration 2 | 51,686 | ||
| Calibration 3 | 53,447 | ||
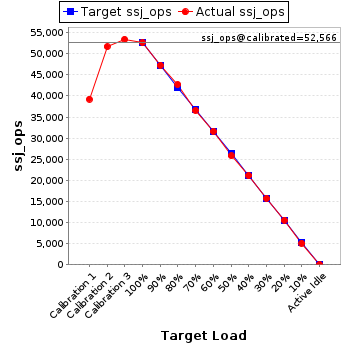
| ssj_ops@calibrated=52,566 | |||
| 100% | 100.2% | 52,566 | 52,655 |
| 90% | 90.0% | 47,310 | 47,292 |
| 80% | 81.3% | 42,053 | 42,721 |
| 70% | 69.5% | 36,796 | 36,556 |
| 60% | 60.2% | 31,540 | 31,642 |
| 50% | 49.1% | 26,283 | 25,819 |
| 40% | 40.2% | 21,027 | 21,137 |
| 30% | 29.9% | 15,770 | 15,741 |
| 20% | 20.1% | 10,513 | 10,567 |
| 10% | 9.6% | 5,257 | 5,062 |
| Active Idle | 0 | 0 | |
| Target Load | Actual Load | ssj_ops | |
|---|---|---|---|
| Target | Actual | ||
| Calibration 1 | 39,794 | ||
| Calibration 2 | 51,953 | ||
| Calibration 3 | 53,462 | ||
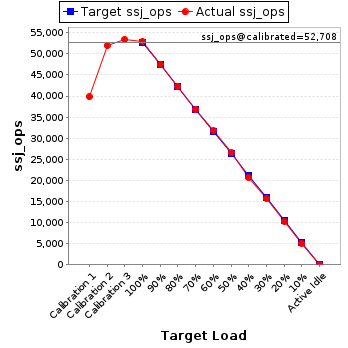
| ssj_ops@calibrated=52,708 | |||
| 100% | 100.5% | 52,708 | 52,951 |
| 90% | 90.1% | 47,437 | 47,513 |
| 80% | 80.2% | 42,166 | 42,286 |
| 70% | 70.0% | 36,895 | 36,913 |
| 60% | 60.2% | 31,625 | 31,712 |
| 50% | 50.4% | 26,354 | 26,540 |
| 40% | 39.2% | 21,083 | 20,650 |
| 30% | 29.8% | 15,812 | 15,683 |
| 20% | 19.4% | 10,542 | 10,233 |
| 10% | 9.6% | 5,271 | 5,067 |
| Active Idle | 0 | 0 | |
| Target Load | Actual Load | ssj_ops | |
|---|---|---|---|
| Target | Actual | ||
| Calibration 1 | 39,638 | ||
| Calibration 2 | 51,853 | ||
| Calibration 3 | 53,495 | ||
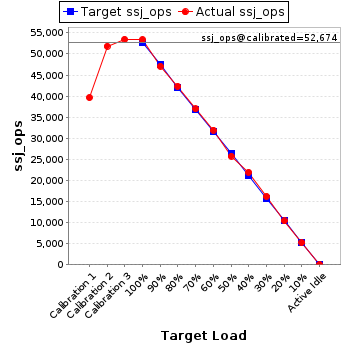
| ssj_ops@calibrated=52,674 | |||
| 100% | 101.4% | 52,674 | 53,391 |
| 90% | 89.4% | 47,407 | 47,093 |
| 80% | 80.4% | 42,139 | 42,346 |
| 70% | 70.1% | 36,872 | 36,950 |
| 60% | 60.6% | 31,604 | 31,943 |
| 50% | 48.9% | 26,337 | 25,733 |
| 40% | 41.6% | 21,070 | 21,933 |
| 30% | 30.8% | 15,802 | 16,221 |
| 20% | 19.7% | 10,535 | 10,362 |
| 10% | 9.9% | 5,267 | 5,229 |
| Active Idle | 0 | 0 | |
| Target Load | Actual Load | ssj_ops | |
|---|---|---|---|
| Target | Actual | ||
| Calibration 1 | 39,586 | ||
| Calibration 2 | 51,948 | ||
| Calibration 3 | 53,633 | ||
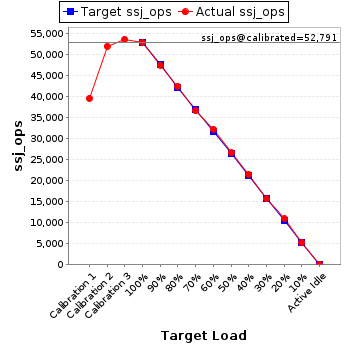
| ssj_ops@calibrated=52,791 | |||
| 100% | 100.0% | 52,791 | 52,784 |
| 90% | 89.9% | 47,511 | 47,483 |
| 80% | 80.5% | 42,232 | 42,473 |
| 70% | 69.3% | 36,953 | 36,606 |
| 60% | 61.1% | 31,674 | 32,251 |
| 50% | 50.4% | 26,395 | 26,588 |
| 40% | 40.7% | 21,116 | 21,496 |
| 30% | 29.6% | 15,837 | 15,630 |
| 20% | 20.7% | 10,558 | 10,921 |
| 10% | 9.8% | 5,279 | 5,171 |
| Active Idle | 0 | 0 | |
| Target Load | Actual Load | ssj_ops | |
|---|---|---|---|
| Target | Actual | ||
| Calibration 1 | 39,714 | ||
| Calibration 2 | 52,140 | ||
| Calibration 3 | 53,430 | ||
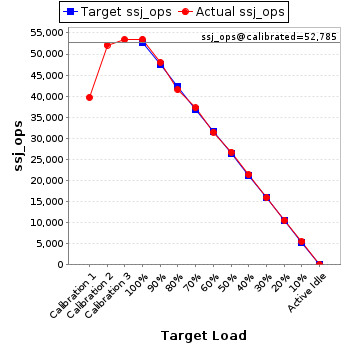
| ssj_ops@calibrated=52,785 | |||
| 100% | 101.4% | 52,785 | 53,510 |
| 90% | 90.9% | 47,507 | 48,001 |
| 80% | 78.7% | 42,228 | 41,535 |
| 70% | 70.5% | 36,950 | 37,213 |
| 60% | 59.6% | 31,671 | 31,469 |
| 50% | 50.6% | 26,393 | 26,717 |
| 40% | 40.5% | 21,114 | 21,362 |
| 30% | 30.1% | 15,836 | 15,892 |
| 20% | 20.0% | 10,557 | 10,546 |
| 10% | 10.4% | 5,279 | 5,504 |
| Active Idle | 0 | 0 | |
| Target Load | Actual Load | ssj_ops | |
|---|---|---|---|
| Target | Actual | ||
| Calibration 1 | 9,203 | ||
| Calibration 2 | 14,777 | ||
| Calibration 3 | 18,882 | ||
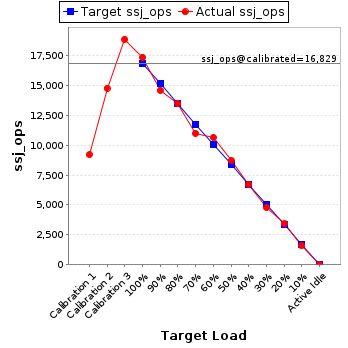
| ssj_ops@calibrated=16,829 | |||
| 100% | 103.3% | 16,829 | 17,382 |
| 90% | 86.8% | 15,146 | 14,605 |
| 80% | 80.2% | 13,463 | 13,504 |
| 70% | 65.4% | 11,780 | 11,003 |
| 60% | 63.4% | 10,098 | 10,668 |
| 50% | 51.9% | 8,415 | 8,732 |
| 40% | 40.1% | 6,732 | 6,742 |
| 30% | 28.5% | 5,049 | 4,789 |
| 20% | 20.4% | 3,366 | 3,429 |
| 10% | 9.4% | 1,683 | 1,587 |
| Active Idle | 0 | 0 | |
| Target Load | Actual Load | ssj_ops | |
|---|---|---|---|
| Target | Actual | ||
| Calibration 1 | 9,173 | ||
| Calibration 2 | 14,542 | ||
| Calibration 3 | 18,892 | ||
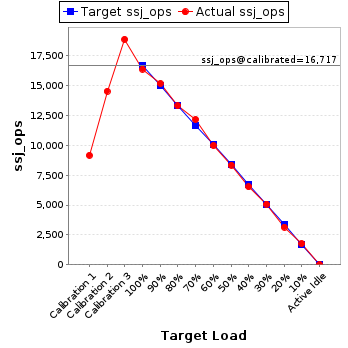
| ssj_ops@calibrated=16,717 | |||
| 100% | 98.1% | 16,717 | 16,397 |
| 90% | 90.9% | 15,045 | 15,189 |
| 80% | 79.7% | 13,374 | 13,317 |
| 70% | 72.8% | 11,702 | 12,169 |
| 60% | 59.7% | 10,030 | 9,984 |
| 50% | 49.9% | 8,359 | 8,340 |
| 40% | 39.0% | 6,687 | 6,524 |
| 30% | 30.4% | 5,015 | 5,083 |
| 20% | 18.9% | 3,343 | 3,154 |
| 10% | 10.6% | 1,672 | 1,767 |
| Active Idle | 0 | 0 | |