SPECpower_ssj2008
Host 'localhost' Performance Report
Copyright © 2007-2026 Standard Performance Evaluation Corporation
| Lenovo Global Technology ThinkSystem ST45 V3 | ssj_ops@100% = 2,700,053 ssj_ops@100% per JVM = 450,009 |
||||
| Test Sponsor: | Lenovo Global Technology | SPEC License #: | 9017 | Test Method: | Single Node |
| Tested By: | Lenovo Global Technology | Test Location: | Beijing, China | Test Date: | Nov 24, 2025 |
| Hardware Availability: | Nov-2025 | Software Availability: | Jun-2025 | Publication: | Jan 27, 2026 |
| System Source: | Single Supplier | System Designation: | Server | Power Provisioning: | Line-powered |
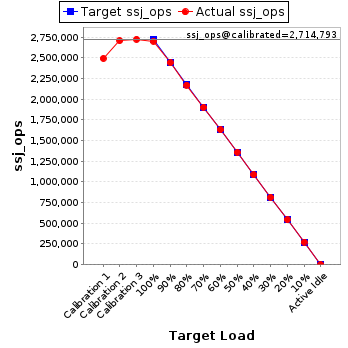
| Target Load | Actual Load | ssj_ops | |
|---|---|---|---|
| Target | Actual | ||
| Calibration 1 | 2,491,782 | ||
| Calibration 2 | 2,706,112 | ||
| Calibration 3 | 2,723,474 | ||
| ssj_ops@calibrated=2,714,793 | |||
| 100% | 99.5% | 2,714,793 | 2,700,053 |
| 90% | 89.9% | 2,443,314 | 2,440,517 |
| 80% | 79.9% | 2,171,834 | 2,169,856 |
| 70% | 70.0% | 1,900,355 | 1,900,987 |
| 60% | 60.0% | 1,628,876 | 1,629,927 |
| 50% | 50.1% | 1,357,397 | 1,358,767 |
| 40% | 40.0% | 1,085,917 | 1,085,282 |
| 30% | 30.0% | 814,438 | 814,844 |
| 20% | 20.0% | 542,959 | 542,270 |
| 10% | 10.1% | 271,479 | 273,520 |
| Active Idle | 0 | 0 | |
| Set Identifier: | sut |
| Set Description: | System Under Test |
| # of Identical Nodes: | 1 |
| Comment: | 'SUT' |
| Hardware | |
|---|---|
| Hardware Vendor: | Lenovo Global Technology |
| Model: | ThinkSystem ST45 V3 |
| Form Factor: | Tower |
| CPU Name: | AMD EPYC 4465P |
| CPU Characteristics: | 12 core, 3.4GHz, 64MB L3 Cache |
| CPU Frequency (MHz): | 3400 |
| CPU(s) Enabled: | 12 cores, 1 chip, 12 cores/chip |
| Hardware Threads: | 24 (2 / core) |
| CPU(s) Orderable: | 1 chip |
| Primary Cache: | 32 KB I + 64 KB D on chip per core |
| Secondary Cache: | 512 KB I+D on chip per core |
| Tertiary Cache: | 64 MB I+D off chip per chip |
| Other Cache: | None |
| Memory Amount (GB): | 32.0 |
| # and size of DIMM: | 2 x 16 GB |
| Memory Details: | 2 x 16GB 1Rx8 PC5-5600;slots 1 and 2 populated |
| Power Supply Quantity and Rating (W): | 1 x 300 |
| Power Supply Details: | Lenovo |
| Disk Drive: | 1 x 480GB M.2 NVMe SSD P/N:4XB7A83139 |
| Disk Controller: | Integrated NVME controller |
| # and type of Network Interface Cards (NICs) Installed: | 1 x ThinkSystem 1GbE RJ45 1-port |
| NICs Enabled in Firmware / OS / Connected: | 1/1/1 |
| Network Speed (Mbit): | 1000 |
| Keyboard: | None |
| Mouse: | None |
| Monitor: | None |
| Optical Drives: | No |
| Other Hardware: | None |
| Software | |
|---|---|
| Power Management: | Enabled (see SUT Notes) |
| Operating System (OS): | SUSE Linux Enterprise Server 15 SP7 |
| OS Version: | 6.4.0-150700.51-default |
| Filesystem: | xfs |
| JVM Vendor: | Oracle Corporation |
| JVM Version: | Java HotSpot(TM) 64-Bit Server VM (build 17.0.10+11-LTS-240, mixed mode, sharing), version 17.0.10 |
| JVM Command-line Options: | -server -Xmn1900m -Xms2048m -Xmx2048m -XX:ParallelGCThreads=2 -XX:+UseLargePages -XX:LargePageSizeInBytes=2m -XX:InlineSmallCode=1500 -XX:UseAVX=1 -XX:AutoBoxCacheMax=20000 -XX:+UseParallelGC -XX:+OptimizeFill -XX:+AggressiveHeap -XX:MaxInlineSize=270 -XX:FreqInlineSize=2500 |
| JVM Affinity: | for each even physicalCoreId { numactl -C physicalCoreId, physicalCoreId + 1, physicalCoreId + 24, physicalCoreId + 25} |
| JVM Instances: | 6 |
| JVM Initial Heap (MB): | 2048 |
| JVM Maximum Heap (MB): | 2048 |
| JVM Address Bits: | 64 |
| Boot Firmware Version: | QIE105F |
| Management Firmware Version: | None |
| Workload Version: | SSJ 1.2.10 |
| Director Location: | Controller |
| Other Software: | None |
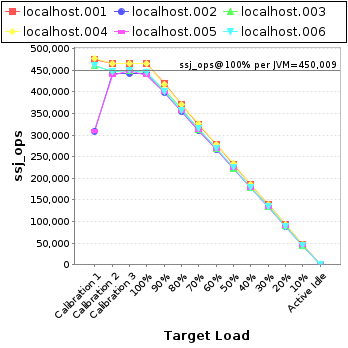
| JVM Instance | ssj_ops@100% |
|---|---|
| localhost.001 | 464,680 |
| localhost.002 | 441,742 |
| localhost.003 | 444,447 |
| localhost.004 | 465,124 |
| localhost.005 | 438,369 |
| localhost.006 | 445,691 |
| ssj_ops@100% | 2,700,053 |
| ssj_ops@100% per JVM | 450,009 |
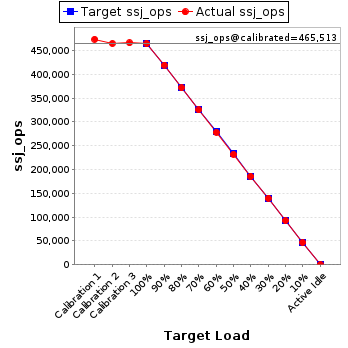
| Target Load | Actual Load | ssj_ops | |
|---|---|---|---|
| Target | Actual | ||
| Calibration 1 | 473,912 | ||
| Calibration 2 | 464,925 | ||
| Calibration 3 | 466,101 | ||
| ssj_ops@calibrated=465,513 | |||
| 100% | 99.8% | 465,513 | 464,680 |
| 90% | 90.2% | 418,962 | 419,752 |
| 80% | 79.8% | 372,410 | 371,641 |
| 70% | 69.9% | 325,859 | 325,370 |
| 60% | 59.8% | 279,308 | 278,222 |
| 50% | 49.8% | 232,756 | 231,938 |
| 40% | 39.9% | 186,205 | 185,693 |
| 30% | 30.0% | 139,654 | 139,871 |
| 20% | 19.9% | 93,103 | 92,477 |
| 10% | 10.1% | 46,551 | 46,868 |
| Active Idle | 0 | 0 | |
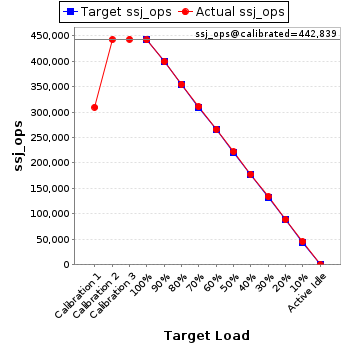
| Target Load | Actual Load | ssj_ops | |
|---|---|---|---|
| Target | Actual | ||
| Calibration 1 | 309,363 | ||
| Calibration 2 | 442,466 | ||
| Calibration 3 | 443,211 | ||
| ssj_ops@calibrated=442,839 | |||
| 100% | 99.8% | 442,839 | 441,742 |
| 90% | 90.2% | 398,555 | 399,388 |
| 80% | 80.1% | 354,271 | 354,695 |
| 70% | 70.2% | 309,987 | 310,730 |
| 60% | 60.1% | 265,703 | 266,108 |
| 50% | 50.1% | 221,419 | 221,906 |
| 40% | 40.2% | 177,135 | 177,904 |
| 30% | 30.2% | 132,852 | 133,740 |
| 20% | 20.0% | 88,568 | 88,783 |
| 10% | 10.2% | 44,284 | 45,261 |
| Active Idle | 0 | 0 | |
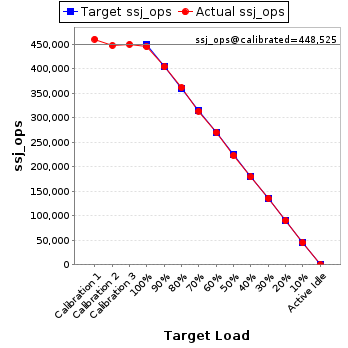
| Target Load | Actual Load | ssj_ops | |
|---|---|---|---|
| Target | Actual | ||
| Calibration 1 | 460,046 | ||
| Calibration 2 | 447,291 | ||
| Calibration 3 | 449,759 | ||
| ssj_ops@calibrated=448,525 | |||
| 100% | 99.1% | 448,525 | 444,447 |
| 90% | 90.1% | 403,672 | 403,921 |
| 80% | 80.6% | 358,820 | 361,394 |
| 70% | 69.9% | 313,967 | 313,400 |
| 60% | 60.2% | 269,115 | 269,992 |
| 50% | 49.6% | 224,262 | 222,541 |
| 40% | 39.9% | 179,410 | 178,996 |
| 30% | 30.2% | 134,557 | 135,495 |
| 20% | 20.0% | 89,705 | 89,926 |
| 10% | 10.1% | 44,852 | 45,083 |
| Active Idle | 0 | 0 | |
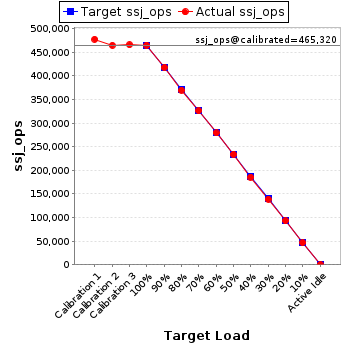
| Target Load | Actual Load | ssj_ops | |
|---|---|---|---|
| Target | Actual | ||
| Calibration 1 | 477,720 | ||
| Calibration 2 | 464,878 | ||
| Calibration 3 | 465,763 | ||
| ssj_ops@calibrated=465,320 | |||
| 100% | 100.0% | 465,320 | 465,124 |
| 90% | 89.8% | 418,788 | 417,951 |
| 80% | 79.5% | 372,256 | 369,870 |
| 70% | 70.1% | 325,724 | 326,051 |
| 60% | 60.0% | 279,192 | 279,050 |
| 50% | 50.3% | 232,660 | 234,034 |
| 40% | 39.9% | 186,128 | 185,684 |
| 30% | 29.9% | 139,596 | 138,909 |
| 20% | 19.9% | 93,064 | 92,771 |
| 10% | 10.0% | 46,532 | 46,675 |
| Active Idle | 0 | 0 | |
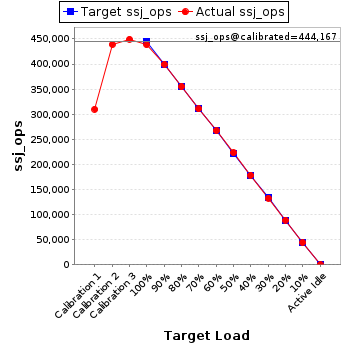
| Target Load | Actual Load | ssj_ops | |
|---|---|---|---|
| Target | Actual | ||
| Calibration 1 | 309,952 | ||
| Calibration 2 | 438,966 | ||
| Calibration 3 | 449,368 | ||
| ssj_ops@calibrated=444,167 | |||
| 100% | 98.7% | 444,167 | 438,369 |
| 90% | 89.9% | 399,750 | 399,443 |
| 80% | 79.9% | 355,334 | 355,107 |
| 70% | 69.9% | 310,917 | 310,629 |
| 60% | 60.2% | 266,500 | 267,267 |
| 50% | 50.2% | 222,084 | 223,141 |
| 40% | 40.1% | 177,667 | 178,244 |
| 30% | 29.9% | 133,250 | 132,740 |
| 20% | 20.0% | 88,833 | 89,002 |
| 10% | 10.0% | 44,417 | 44,396 |
| Active Idle | 0 | 0 | |
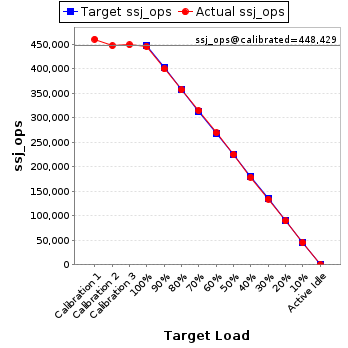
| Target Load | Actual Load | ssj_ops | |
|---|---|---|---|
| Target | Actual | ||
| Calibration 1 | 460,789 | ||
| Calibration 2 | 447,587 | ||
| Calibration 3 | 449,272 | ||
| ssj_ops@calibrated=448,429 | |||
| 100% | 99.4% | 448,429 | 445,691 |
| 90% | 89.2% | 403,587 | 400,061 |
| 80% | 79.6% | 358,744 | 357,150 |
| 70% | 70.2% | 313,901 | 314,806 |
| 60% | 60.1% | 269,058 | 269,288 |
| 50% | 50.2% | 224,215 | 225,207 |
| 40% | 39.9% | 179,372 | 178,762 |
| 30% | 29.9% | 134,529 | 134,090 |
| 20% | 19.9% | 89,686 | 89,312 |
| 10% | 10.1% | 44,843 | 45,237 |
| Active Idle | 0 | 0 | |
